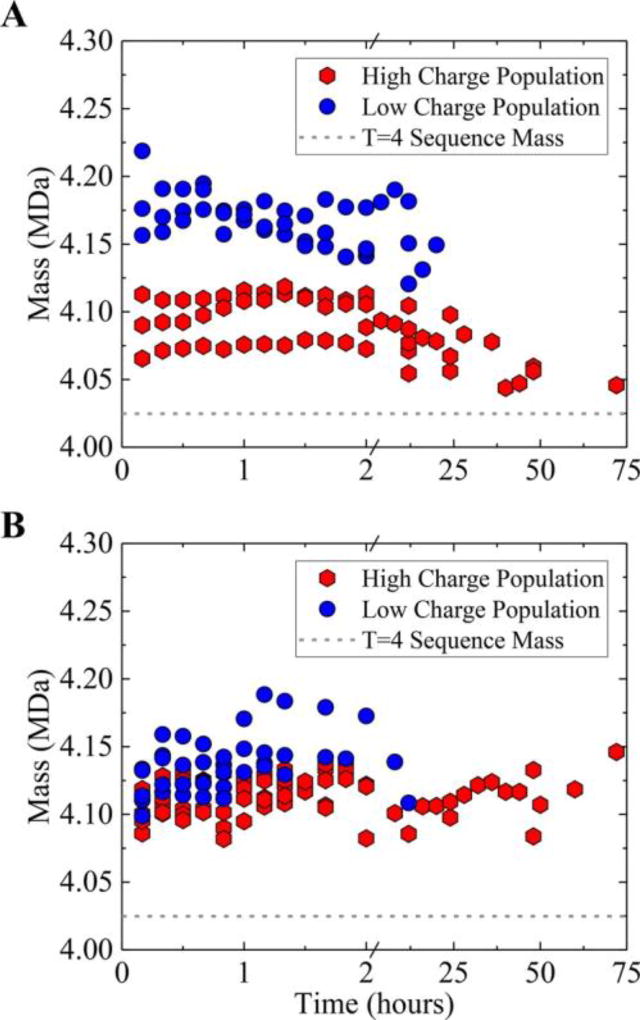
Figure 5.
Relaxation of high charge and low charge populations as a function of time. (A) Plot showing the center mass of each charge population (see text) plotted against reaction time for three independent experiments. The higher charge population (around 155e) is the red hexagons and the lower charge population (around 140 e) is the blue circles. The gray dashed line shows the sequence mass of the T = 4 capsid. The three experiments have slightly different amounts of overgrowth but show the same trend. (B) A similar plot recorded for assembly in 510 mM ammonium acetate. In the higher salt solution the overgrown capsids remain trapped on the time scale shown in the plot.

