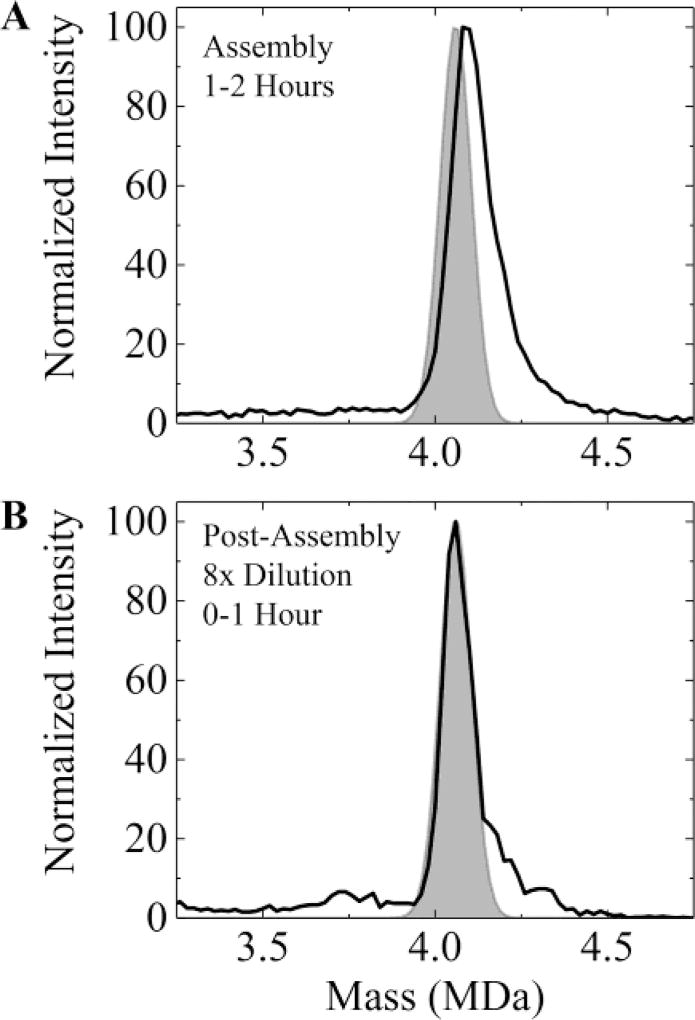
Figure 6.
Relaxation of high mass populations as a function of ionic strength. (A) The solid line shows the mass spectrum measured 1–2 h after initiation of assembly of 10 µM dimer in 210 mM ammonium acetate. The shaded area shows the expected peak position and width for a T = 4 capsid with 120 dimers (taking into account the ~0.6% shift due to solvent). (B) The solid line shows the spectrum measured 0–1 h after dilution of the sample in (A) by a factor of 8 to give a final ammonium acetate concentration of 26 µM. The dilution was performed 2 h after initiation of the assembly reaction. In (A) the capsid peak is broader and at a higher mass than expected for the T = 4 capsid. In (B) the peak is at the expected position for the T = 4 capsid though some of the high mass tail persists.

