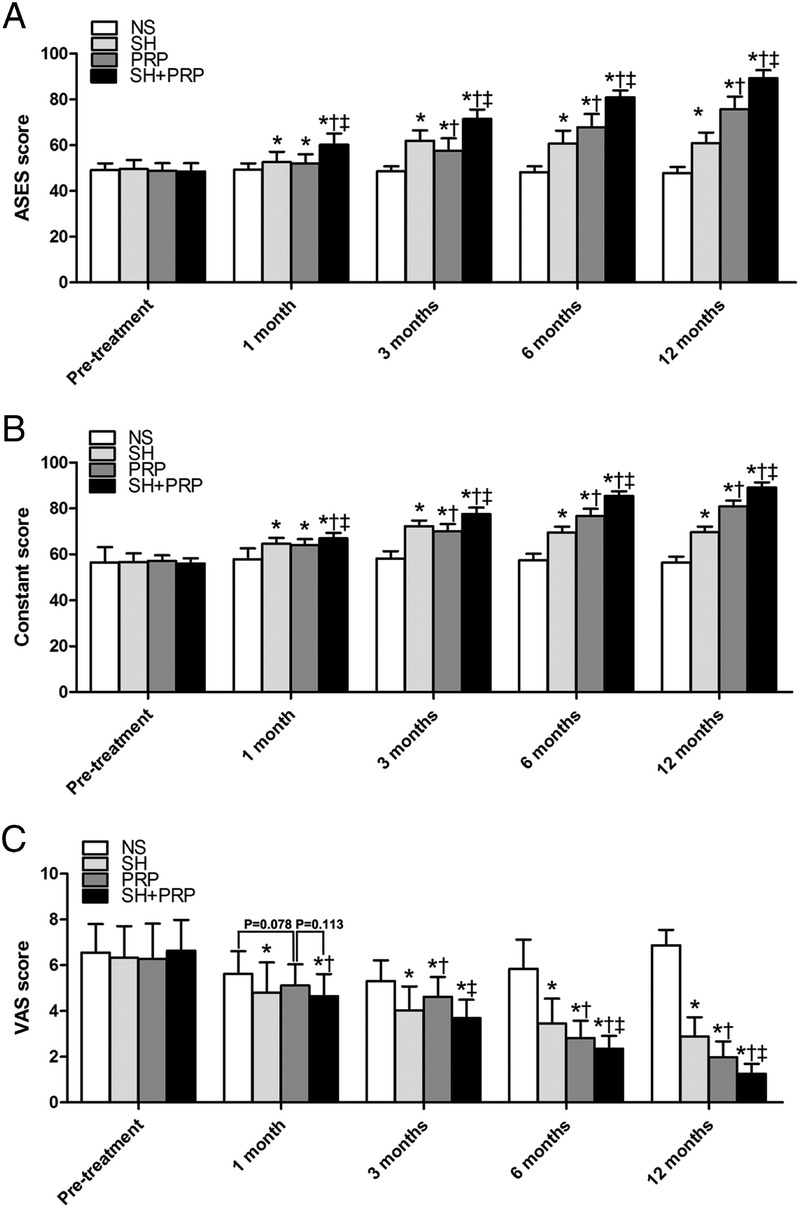
FIGURE 3.

A, B, and C, The mean ASES scores, Constant scores, and VAS scores of the four groups, respectively. *P < 0.01 vs NS. †P < 0.01 vs SH. ‡P < 0.01 vs PRP.

A, B, and C, The mean ASES scores, Constant scores, and VAS scores of the four groups, respectively. *P < 0.01 vs NS. †P < 0.01 vs SH. ‡P < 0.01 vs PRP.