
Figure 1|. Aferric E. coli siderophore enterobactin (Ent) inhibits MPO activity.
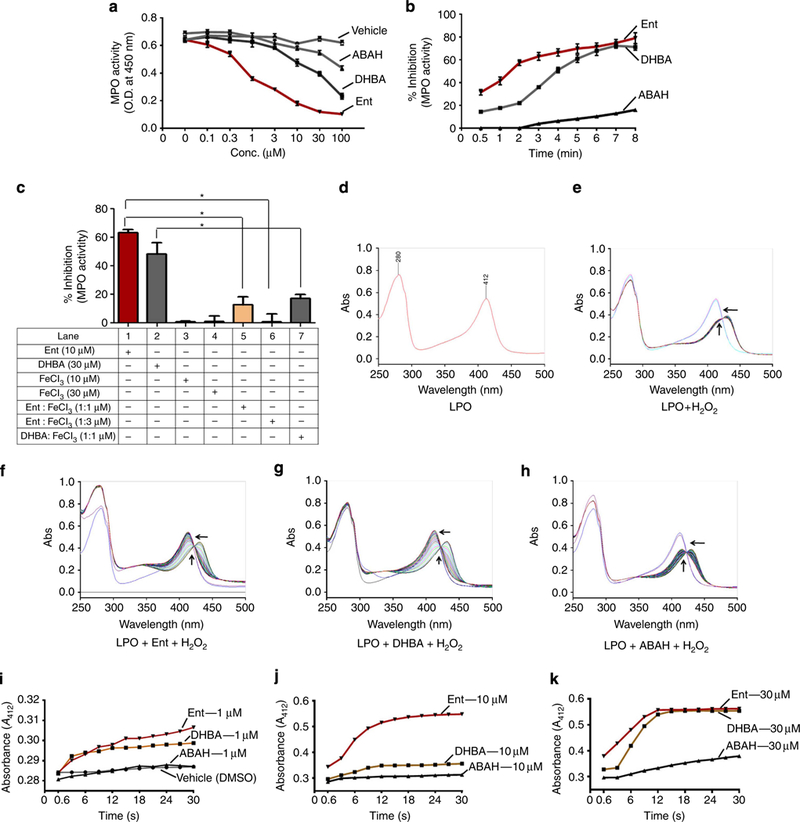
Ent, DHBA or ABAH was pre-incubated at the below indicated final concentrations, with 100mU of MPO for 10 min and then MPO activity was quantitatively measured using guaiacol (100mM) and H2O2 (6.7×10⁻³ %). Line graph represents (a) dose- (0.1–100μM) and (b) time (0.5–8min)-dependent inhibition of MPO activity by 30 μM of Ent, DHBA or ABAH. (c) Ent or DHBA was pre-incubated with FeCl3 for 1 min and subsequently incubated with MPO for 10min. Bar graph represents percent inhibition of MPO activity by apo- or Feþ3-saturated Ent or DHBA. Assays were carried out in 96-well plates in triplicate with appropriate vehicles/buffers throughout the study. (d–h) To perform spectral analysis, LPO (2.6nM, in 0.1M phosphate buffer) was incubated with various concentrations of Ent, DHBA or ABAH for 1 min. The reaction was initiated by the addition of 30 μM H2O2. Spectra (250–500 nm) were recorded up to 3 min. Each spectrum is an average of three scans taken in 1.0 s. Image displays the spectra of (d) LPO alone, (e) LPOþH2O2, (f) LPOþEnt (30 μM)þH2O2, (g) LPOþDHBA (30 μM)þH2O2 and (h) LPOþABAH (30 μM)þH2O2. (i–k) Time-dependent change in the absorbance spectra of LPO at 412 nm at various concentrations of ABAH, Ent and DHBA. Arrows indicate the direction of spectral changes, that is, conversion of oxoiron [Fe(IV)¼O] to the native form [Fe(III)]. Results are expressed as mean±s.e.m. and are representative of six independent experiments (a–c). Data represent one of three similar experiments (f–k).*P<0.05, unpaired t-test.