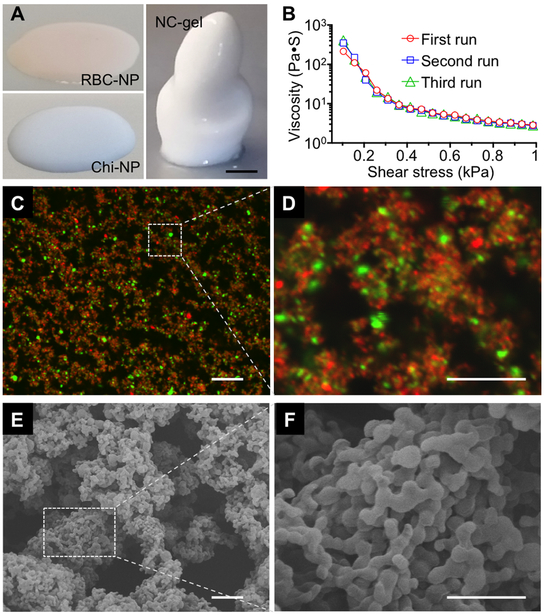
Figure 2. Characterization of the NC-gel.
(A) Images of RBC-NPs, Chi-NPs, and NC-gel samples when they were placed onto a flat substrate. Scale bar = 5 mm. (B) Viscosity measurements were performed on the same NC-gel sample at 25°C for three consecutive runs without interval between each run. (C) A representative fluorescence image of the NC-gel, in which RBC-NPs were labeled with DiD dye (red) and Chi-NPs with DiO dye (green). Scale bar = 1 µm. (D) A zoomed-in image of the marked area in (C). Scale bar = 10 µm. (E) A representative scanning electron microscopy (SEM) image of NC-gel. Scale bar = 1 µm. (F) A zoomed-in SEM image of the marked area in (E). Scale bar = 0.5 µm.

