
Figure 1. Clustering of brain myeloid cells across developmental stages by deep scRNA-seq.
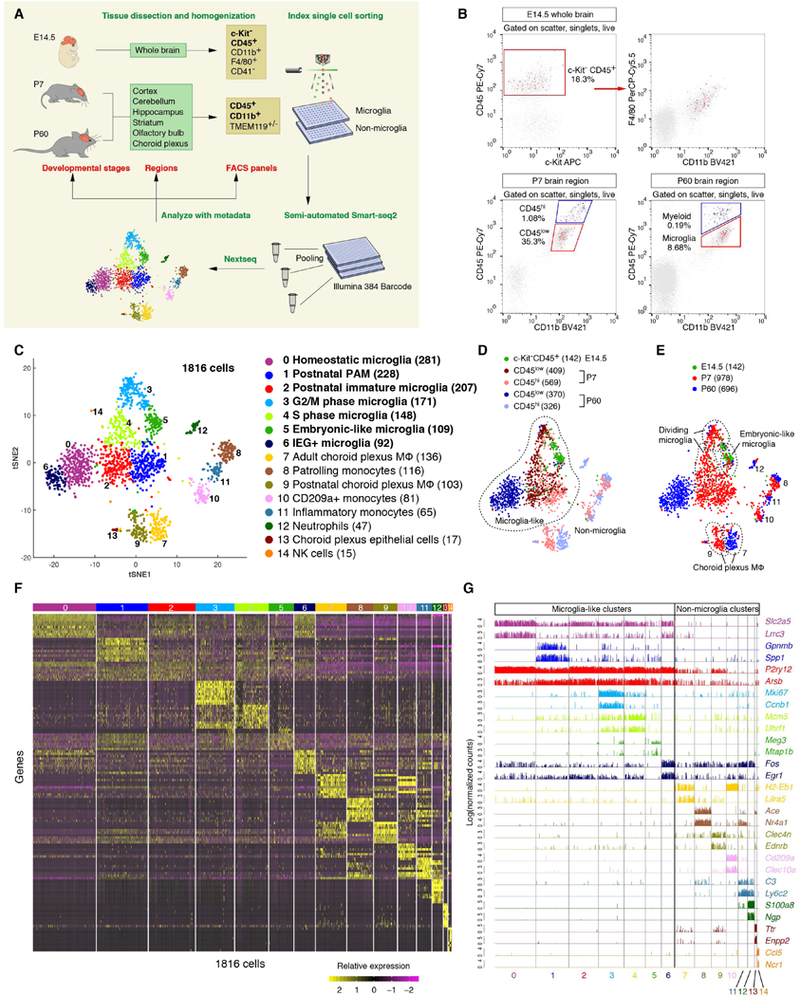
(A) Schematic graph showing the experimental design. c-Kit−CD45+ (bold) was the sorting gate for E14.5 cells, and CD45+CD11b+ (bold) was for P7 and P60 cells. Other surface markers were recorded as metadata. (B) Representative FACS plots showing the cells sequenced (red or blue). (C) tSNE plot showing 15 clusters and population annotations with microglia-like clusters in bold and the number of cells in parentheses. (D) Overlaying FACS gating information onto the same tSNE plot in (C). The vast majority of P60 microglia are CD45low, while P7 microglia are comprised of both CD45low and CD45hi cells. Almost all cells from non-microglia clusters are CD45hi. (E) Overlaying developmental stage information onto the same tSNE plot in (C). (F) Heatmap showing the top 20 markers (or all markers if less than 20) for each of the 15 clusters. (G) Bar plots showing gene expression levels of two representative markers for each cluster. See also Figure S1, Table S1.