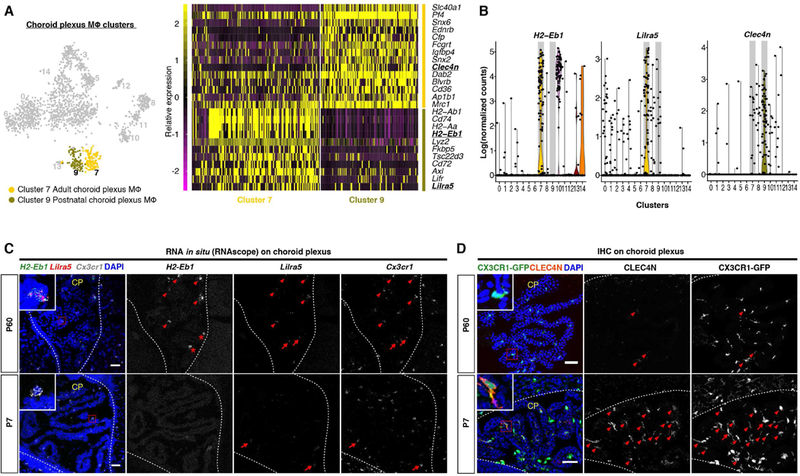
Figure 2. Postnatal transcriptional alteration of choroid plexus macrophages (CP MΦ).

(A) tSNE plot (left) and heatmap (right) highlighting two stage-specific CP MΦ clusters and differentially expressed genes. Genes for validation in (C) and (D) are underlined and in bold. (B) Violin plots showing that H2-Eb1 and Lilra5 are highly expressed by adult CP MΦ (cluster 7), and Clec4n is highly enriched in early postnatal CP MΦ (cluster 9). (C) RNA in situ validation of abundant H2-Eb1 and Lilra5 expression in P60 CP MΦ (H2-Eb1+Lilra5+Cx3cr1+, arrow heads) but not in P7 cells. H2-Eb1− Cx3cr1+Lilra5+ (arrows) cells were occasionally seen in both stages. H2-Eb1+Lilra5− Cx3cr1− (asterisks) are non-myeloid cells. (D) Immunostaining validation of more abundant CLEC4N expression in P7 CP MΦ (CLEC4N+CX3CR1-GFP+, arrow heads). CLEC4N−CX3CR1-GFP+ (arrow) cells also exist in P7. CP, choroid plexus. Dashed lines demarcate ventricle borders. Scale bars in (C) and (D) are 50um.
