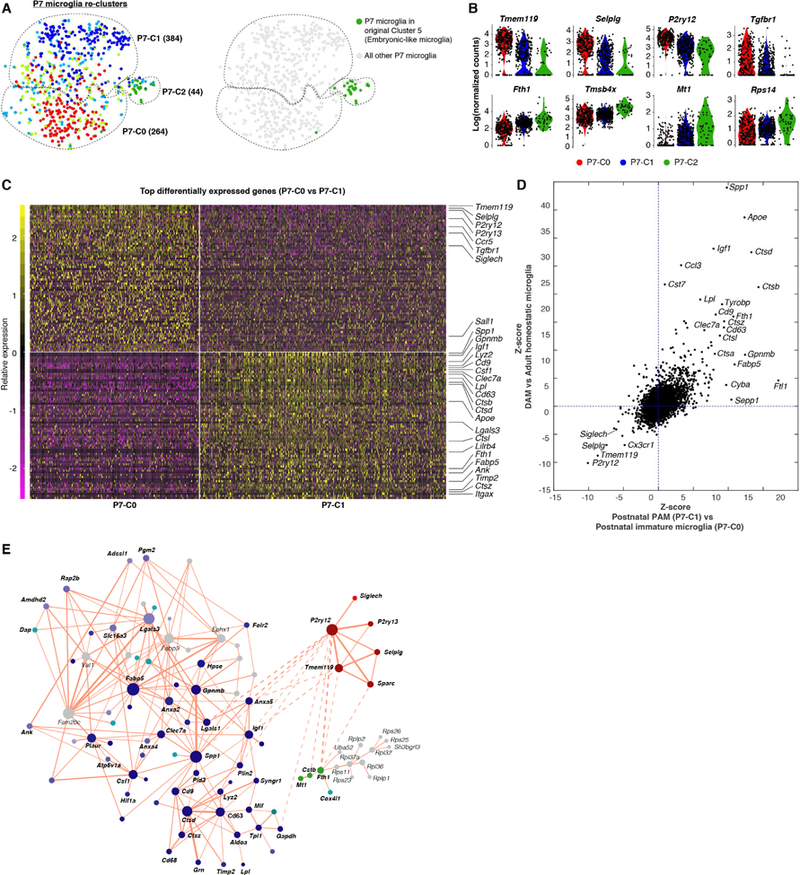
Figure 5. Heterogeneity of early postnatal microglia revealed by scRNA-seq.

(A) Re-clustering of P7 microglia (as in Figure 4A) to highlight that P7-C2 are mainly embryonic-like cells (cluster 5) in the original clustering result. (B) Violin plots showing some differentially expressed genes between P7-C2 and the other two clusters. (C) Heatmap showing top 70 differentially expressed genes between P7-C0 and P7-C1. P7-C0 express higher levels of homeostatic genes and P7-C1 enrich many disease-associated genes. (D) Comparison of gene expression changes in DAM (relative to homeostatic microglia) with the changes in P7-C1 (relative to P7-C0) showing similar sets of up-and down-regulated genes in two cases. (E) Gene network showing correlated gene modules underlying cluster identities of P7 microglia (See STAR Methods). Each gene is colored based on its differential expression levels among three P7 clusters. Solid lines are for positive correlation and dashed lines are for negative correlation. See also Table S5.
