
Figure 8. Phagocytosis of newly formed oligodendrocytes by early postnatal PAM.
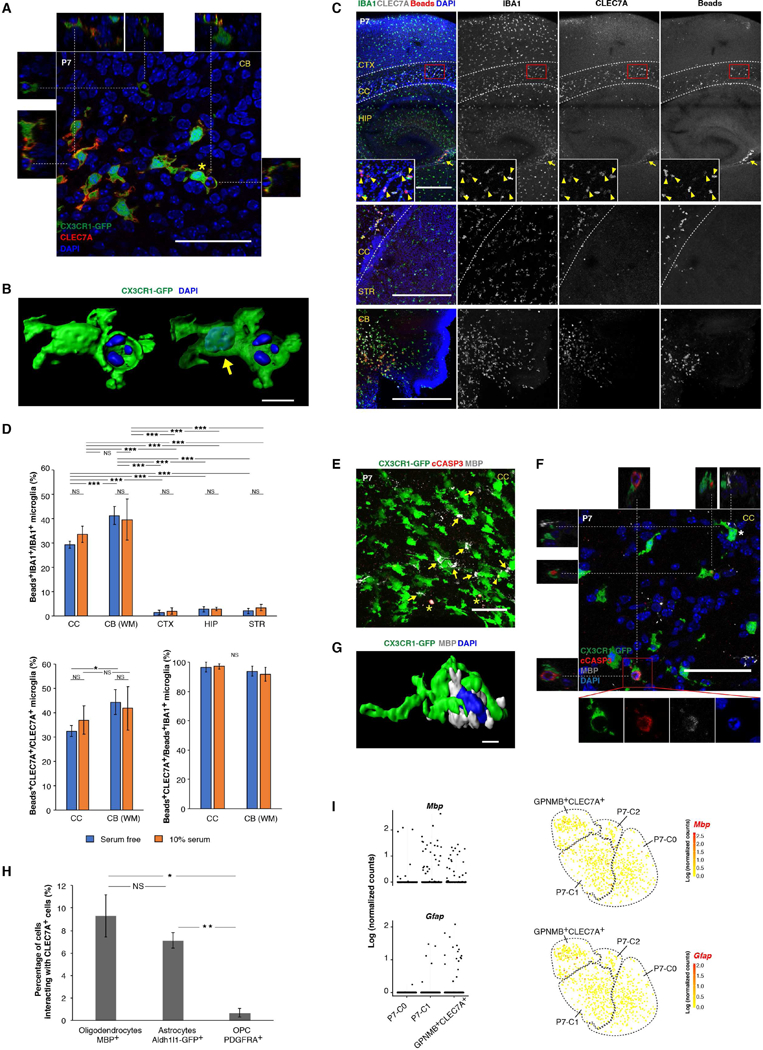
(A) Single optical section of a confocal image (full stack in Movie S1) showing engulfment of nuclei by CLEC7A+ microglia in the P7 cerebellar white matter. Images from the X-Z and Y-Z axes are shown on the top and sides, respectively. (B) 3D reconstruction of a CLEC7A+ microglia (asterisk in (A)) engulfing a pyknotic nucleus. Arrow points to the microglia nucleus in transparent rendering of the CX3CR1-GFP channel. (C) Phagocytosis on slice culture sections showing that pH-sensitive beads were engulfed by CLEC7A+ microglia in CC (arrow heads) and CB white matter but rarely in other regions. Arrow points to beads-eaten CLEC7A+ cells near ventricles. (D) Quantification of the phagocytosis assay in (C). n=5 sections (3 fields for each section). *** P<0.001, ** P<0.01, * P<0.05. WM: white matter. (E) Immunostaining of P7 corpus callosum (CC) showing interactions between early postnatal PAM and MBP+ oligodendrocytes (arrows). Asterisks label cCASP3+ oligodendrocytes. Arrow head points to cCASP3+ inclusion in microglia. (F) Single optical section of a confocal image showing engulfment of cCASP3+ oligodendrocytes (inset) by CLEC7A+ microglia in the P7 CC. Images from the X-Z and Y-Z axes are shown on the top and left, respectively. The microglial cell (asterisk) physically contacting an oligodendrocyte is 3D reconstructed in (G). (H) Quantification for percentage of each cell type interacting with CLEC7A+ cells in CC. n=3 sections each. ** P<0.01, * P<0.05. (I) Mbp and Gfap transcripts in different P7 populations by scRNA-seq. tSNE plots (same as in Figure 6H) on the right highlight cells that have detectable Mbp or Gfap expression. Scale bars: 50um in (A), (E) and (F); 500um in (C); 10um in (B) and (G). Data are represented as mean ± SEM in (D) and (H). See also Figure S7, Table S6, Table S7, Movie S1, Movie S2.