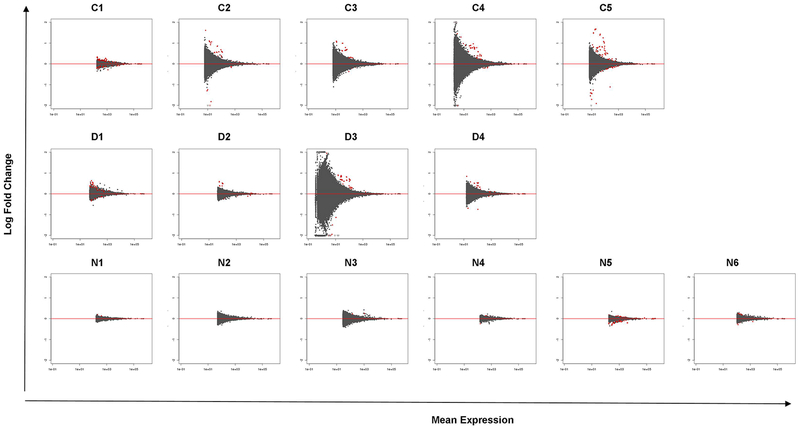
Figure 3: MA plot of each analyzed subject in the normal control group (C1–5 from left to right, top row), CGD patients (D1–4 from left to right, middle row) and of IFNGRD patients (N1–6 from left to right, bottom row).
Mean expression versus log2 fold change plot. Significant hits (at padj < 0.1) are colored in red. Less number of significant exons is detected in the IFNGRD group when compared to the healthy and CGD groups reflecting the impairment of the activation of the IFN-γ signaling pathway.

