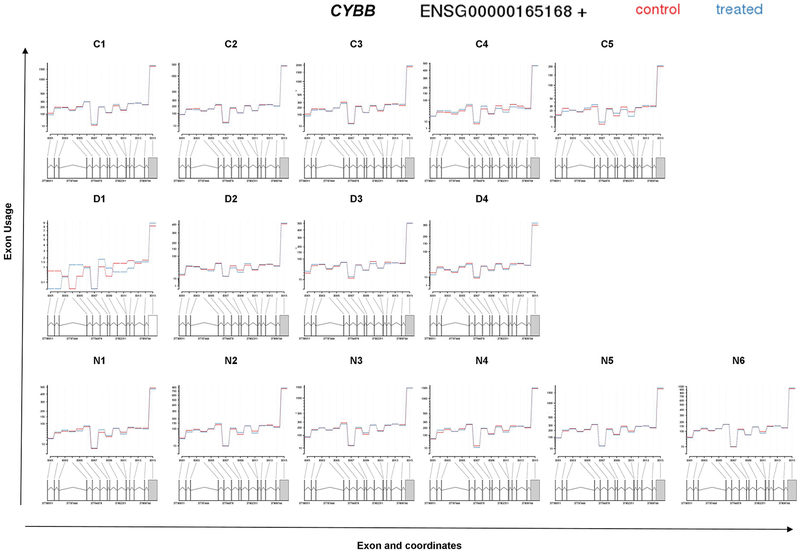
Figure 4: Fitted expression of CYBB of each analyzed subject in the normal control group (C1–5 from left to right, top row), CGD patients (D1–4 from left to right, middle row) and of IFNGRD patients (N1–6 from left to right, bottom row).
The plot represents the expression estimates from a call to test for Differential Exon Usage (DEU). No significant differential exon usage was detected for CYBB, an interesting change of profile of DEU was detected in CGD patient D1.

