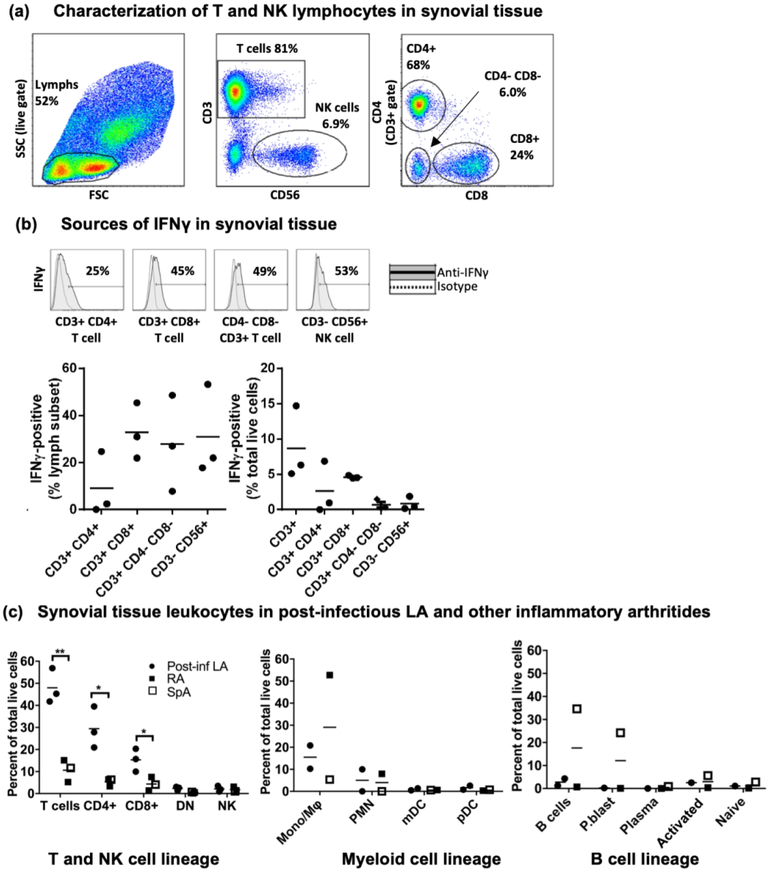
Fig 1: Robust IFNγ production by T cells and NK cells in post-infectious LA synovial tissue.
(a) Characterization of lymphocyte subsets in synovial tissue by flow cytometric analysis collected from 3 patients with post-infectious LA at time of synovectomy. (b) Identification of cellular sources of IFNγ in synovial tissue by intracellular cytokine staining. (c) Comparisons of leukocyte subsets between patients with post-infectious LA vs. other inflammatory arthritis, as a percent of total live cells. Closed circles indicate LA patients, closed squares indicate rheumatoid arthritis (RA) patients, and open squares indicate ankylosing spondylitis (SpA) patient. See Supplemental Figure S1 for myeloid cell and B cell lineage gating strategies. Statistically significant differences between groups were determined by 2-tailed t-test (* p<0.05, ** p<0.01). Abbreviations: side scatter (SSC), forward scatter (FSC), natural killer cell (NK), CD3+/CD4-/CD8- double-negative T cell (DN), monocyte/macrophage lineage (Mono/Mϕ), polymorphonuclear leukocyte (PMN), myeloid-derived dendritic cells (mDC), plasmacytoid dendritic cell (pDC), plasmablast (P.blast).

