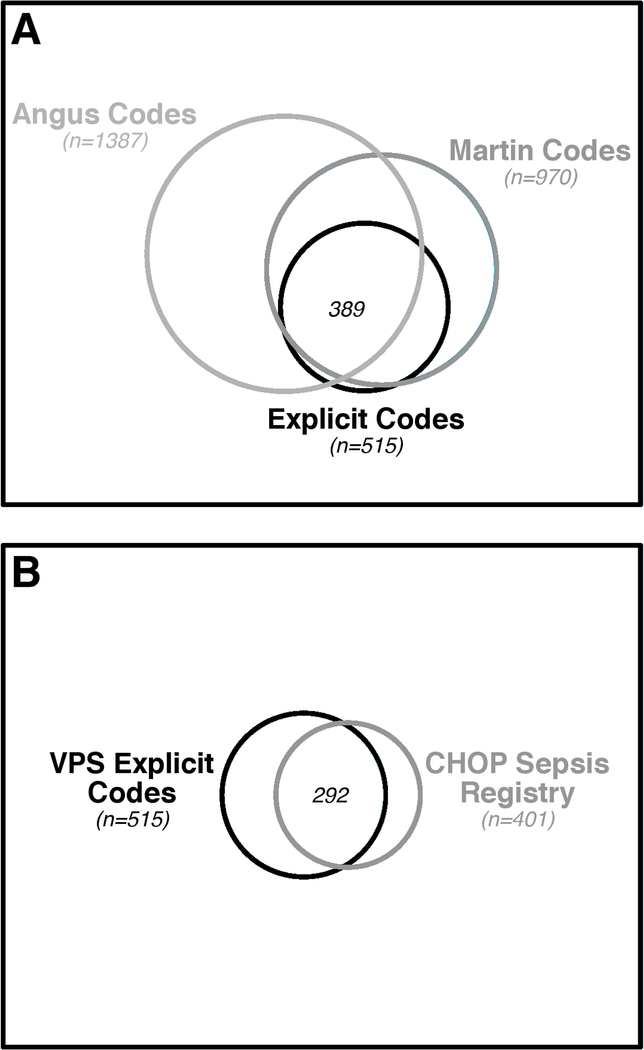
Figure 1.
Venn diagrams of the overlapping cohorts of patients identified by the VPS search algorithms (panel A), and the overlap between patients identified by VPS explicit codes and patients prospectively identified in the reference standard cohort (panel B). The area of the outer box represents the total population, and circles represent the proportional area attributable to each subgroup. The proportional sizes of circles are consistent across panels to allow for comparison to the reference standard cohort.

