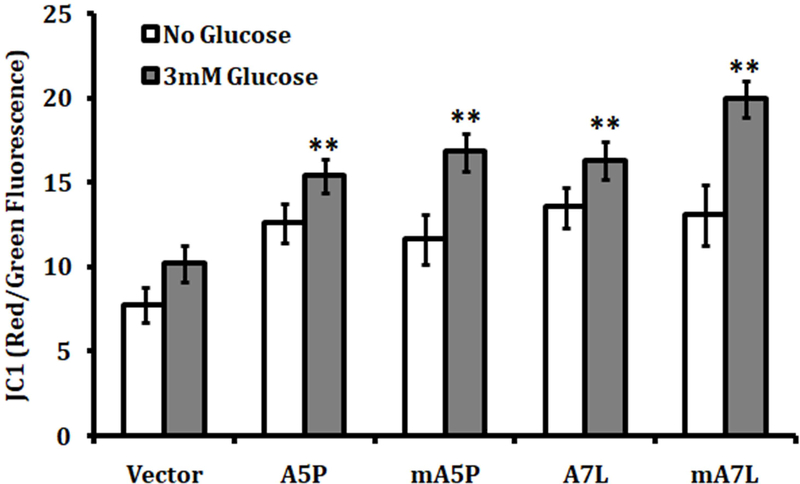
Figure 4. The effect of GPX1 isoforms on mitochondrial membrane potential.
The mitochondrial membrane potential of transfected cells was determined using JC-1 fluorescence detection described in the Methods. The data is the ratio of red fluorescence (595 nm) which is proportional to the membrane potential and the green fluorescence (535 nm) which is emitted in necrotic or apoptotic cells. The statistical significances were calculated from the similarly treated vector transfected control and the values are the means ± sd, n = 3. ** P < 0.001.

