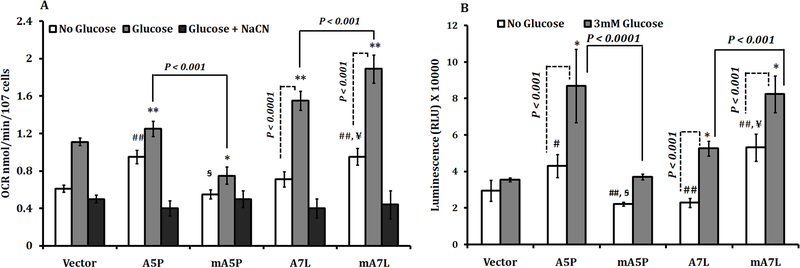
Figure 5. Oxygen consumption and ATP levels in MCF7 cells expressing different GPX1 isoforms.
(A) NaCN sensitive oxygen consumption was measured in the presence of reduced levels (Figure 5) in absence of 3mM glucose as described in the Methods. The statistical significances were calculated from the similarly treated vector transfected control and the values are the means ± sd, n = 3. ## P < 0.001 versus non-treated vector, * P<0.05, **P<0.001 versus glucose treated vector, P<0.05 versus non-treated A5P, P<0.001 versus non-treated A7L. (B) ATP levels were estimated in the presence or in absence of 3mM glucose. The statistical significances were calculated from the similarly treated vector transfected control and the values are the means ± sd, n = 3. # P < 0.05 versus non-treated vector ## P < 0.001 versus non-treated vector, * P<0.001 versus glucose treated vector, #P<0.001 versus non-treated A5P, P<0.001 versus non-treated A7L.

