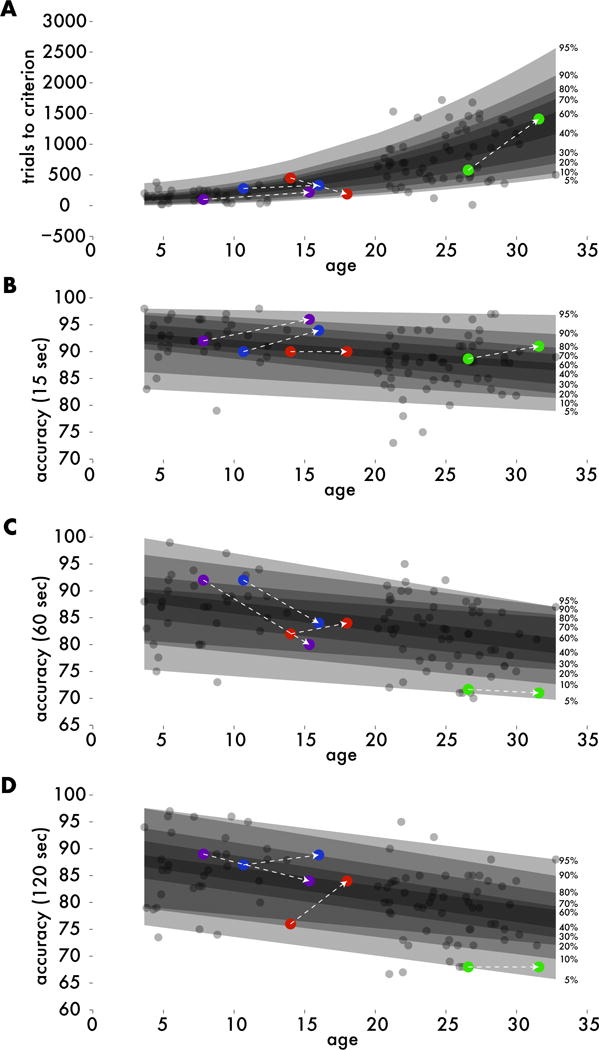
Figure 3. Correcting for age-related performance changes.

Quantile regression estimated the unique distribution of performance scores across the rhesus lifespan (transparent patches). Each experimental animal’s (colored dots) raw performance metrics were converted to a relative percentile compared to age-matched controls (gray dots). A. Number of trials performed before reaching performance criteria before implant was best fit with a second-order model. B-D. Recognition performance (percent correct) at 15, 60, and 120 second delay intervals were best fit with first-order models.
