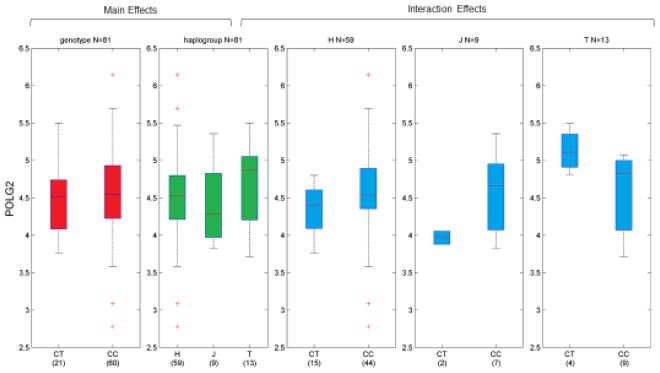
Figure 4.
Interaction Box-Plots for expression of POLG2 (Geuvadis). Normalized gene expression (y-axis) is plotted by genotype/haplogroup combination in European-descent populations for rs978490. We observe a significant interaction between genotype and haplogroup, driven by a change in slope in the T haplogroup; for other groups, POLG2 expression is either equal to or slightly increasing with the number of copies of the C allele.

