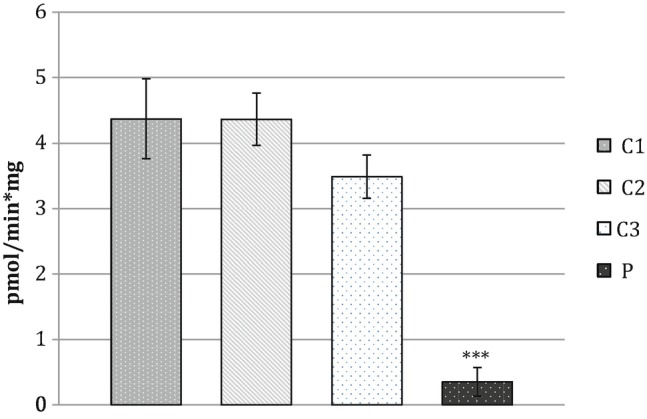
Fig. 1.

The rate of FAD synthesis was measured in fibroblasts from the patient (P) and from three control individuals (C1, C2, and C3), as described in Sect. 3. Data represent the mean ± SD of two independent cell lysates; student’s t-test: ***p < 0.001
