Figure 3.

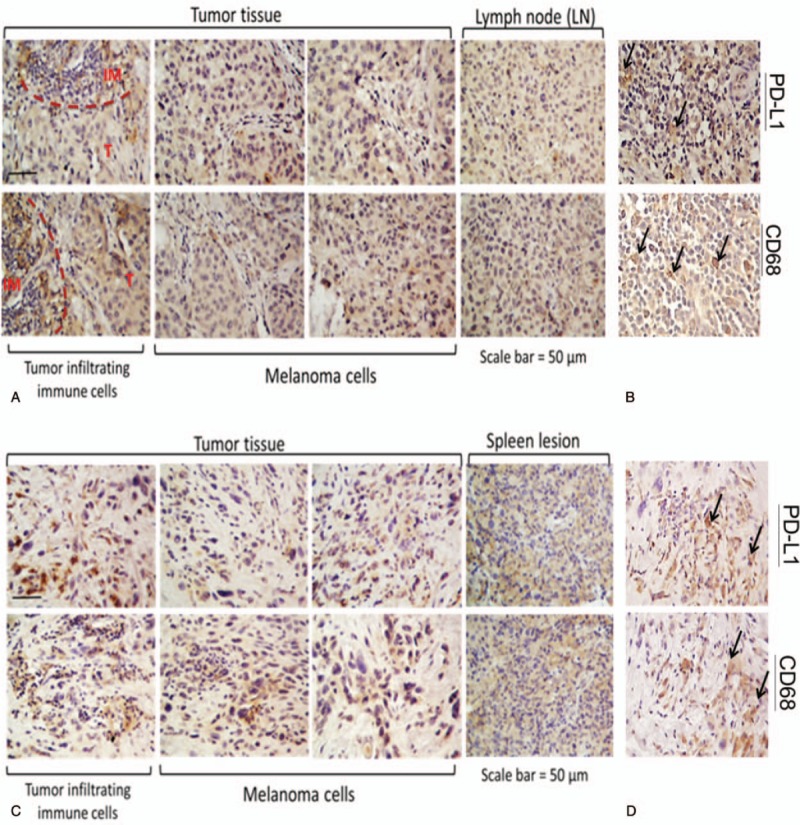
Immunohistochemical staining of the neck, lymph node, and spleen lesions. (A) Visualization of PD-L1 expression in the neck and lymph node lesions before combination therapy with BRAF and MEK inhibitors (December 3, 2013). The areas circled with red dashed lines indicate the presence of immune cells (IM) adjacent to tumor cells (T). Moderate expression of PD-L1 appears in both immune cells and tumor cells. (B) Colocalization of PD-L1 and macrophage marker CD68 in the neck lesion. Several tumor infiltrating macrophages (black arrows) also express PD-L1. (C) Visualization of PD-L1 expression in the neck and spleen lesions from the same patient resistant to a combination therapy with BRAF and MEK inhibitors (September 4, 2015). High levels of PD-L1 are present in tumor infiltrating immune cells and tumor cells. (D) Same observation as panel B above, from the 2015 sample of the neck lesion.
