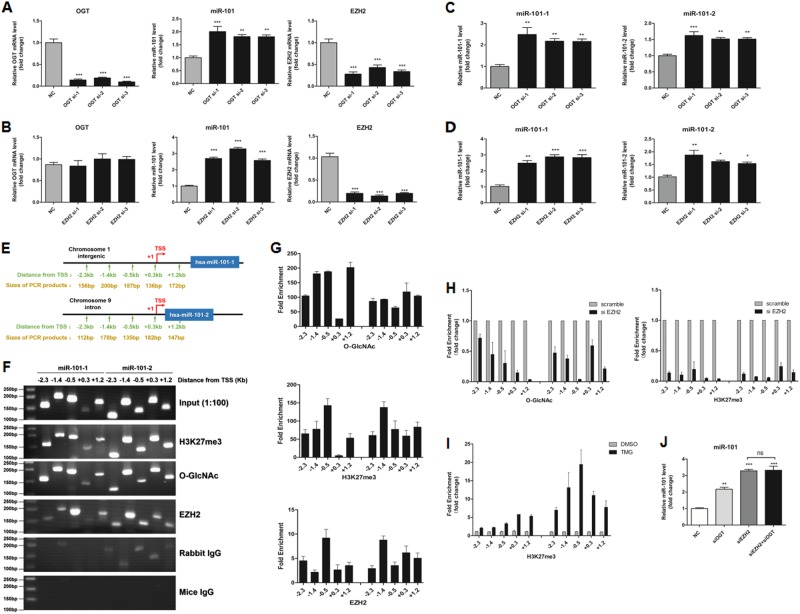
Fig. 6.
miR-101 is epigenetically silenced by OGT and EZH2 in colorectal cancer cells. a, b OGT and EZH2 mRNA levels and miR-101 expression levels were assessed by real-time PCR analysis of SW480 cells that had been treated with siScramble (NC), siOGT (a), or siEZH2 (b) for 72 h. c, d PremiR-101-1 and premiR-101-2 expression levels were assessed by real-time PCR analysis of SW480 cells that had been treated with siScramble (NC) or siOGT (c) or siEZH2 (d) for 72 h. The values shown are expressed as the means ± SEM of three independent experiments. e Schematic representation of the location of ChIP-qPCR primers in the precursor miR-101-1 and miR-101-2 upstream transcriptional start regions (TSSs) and of the sizes of the PCR products. f, g ChIP-qPCR assays revealed that H3K27me3, O-GlcNAcylation, and EZH2 bind the TSSs of precursor miR-101-1 and miR-101-2 in SW480 cells. h ChIP-qPCR analysis of O-GlcNAcylation and H3K27me3 at miR-101’s promoter regions in SW480 cells that had been treated with siScramble or siEZH2. Normalized O-GlcNAcylation and H3K27me3 levels at the promoter regions of miR-101 in the siEZH2 group are presented relative to those in the siScramble group. The values shown represent the means ± SEM. i ChIP-qPCR analysis of H3K27me3 at miR-101’s promoter regions in SW480 cells after 12 h of treatment with TMG (10 μmol/L) or isometric DMSO. Normalized O-GlcNAcylation and H3K27me3 levels at miR-101’s promoter regions in the TMG group are presented relative to those in the DMSO group. The values shown are expressed as the means ± SEM. j miR-101 expression levels were assessed by real-time PCR analysis of SW480 cells that had been treated with siScramble (NC), siOGT, siEZH2 or siOGT, and siEZH2 combined for 72 h

