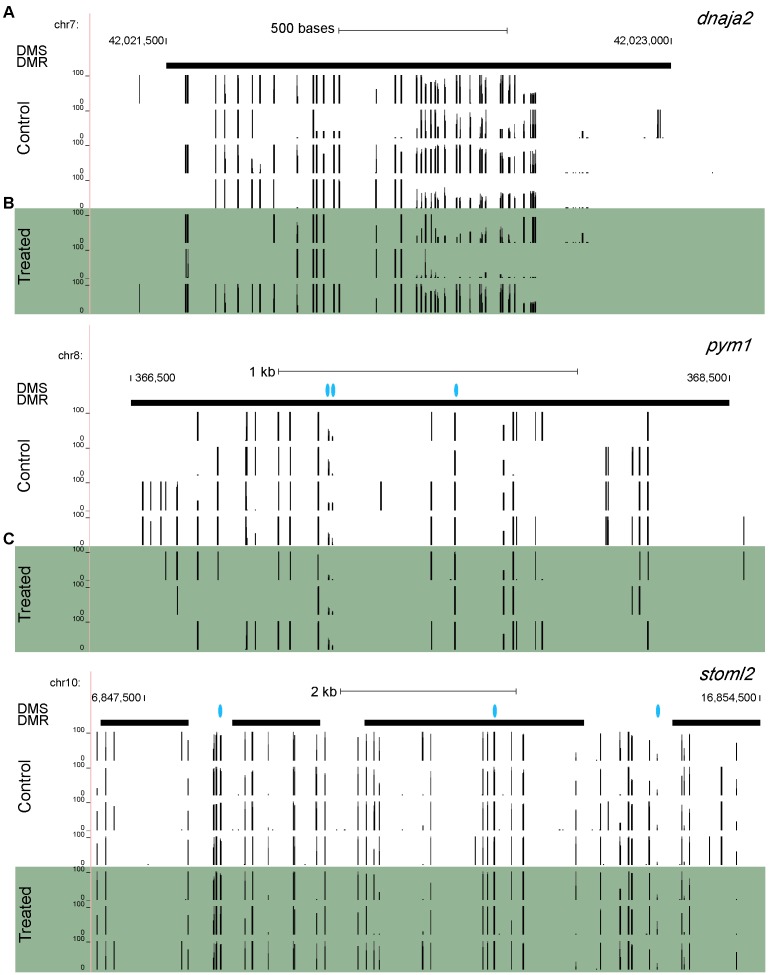
FIGURE 3.
Maps of individual methylated sites linked to three genes: (A) dnaja2, (B) pym1, and (C) stoml2. Vertical black bars indicate individual DNA methylation sites and height of the bars represents methylation value. Blue dots represent differentially methylated CpG sites, and bolded horizontal black bars represent differentially methylated regions. Each row represents a different sample.

