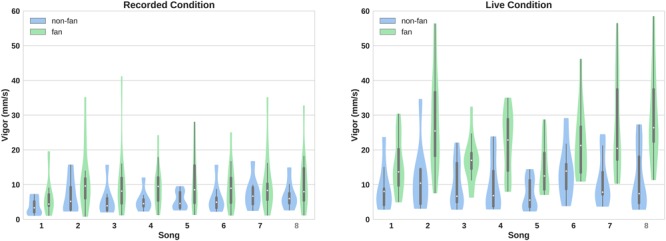
FIGURE 1.

Vigour of head movements across songs. The distance travelled within a song was divided by the total length of the song, giving a value in millimetres per second. Fans moved with greater vigour than Neutral-listeners for every song and those in the Live Concert condition moved with greater vigour than those in the Album-playback Concert condition for every song. Vigour varied among songs, and was qualified depending on Concert-status (Live, Album-playback). The songs were: (1) “Just to Know I Can”; (2) “How Long”; (3) “Fool”; (4) “Elouise”; (5) “Frozen Pond”; (6) “Feel”; (7) “Secrets”; and (8) reinterpretation of “Blown Wide Open.” The violin plots show the same parameters as a standard box plot (range, interquartile range and median) as well as a kernel density plot that estimates the continuous distribution of the data.
