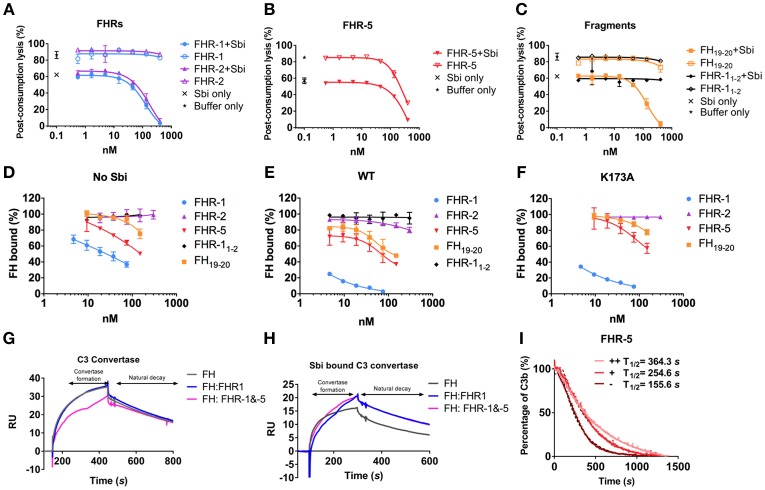
Figure 3.
Functional characterization of tripartite complexes in complement AP regulation. NHS was incubated with Sbi-III-IV, in combination with specified reagents or just buffer, the consumption of AP activity was indicated by the protection of rabbit red blood cell from lysis. (A) Pre-incubation of recombinant FHR-1 or−2 with the presence or absence of Sbi-III-IV. (B) Pre-incubation of recombinant FHR-5 in the presence or absence of Sbi-III-IV. (C) Pre-incubation of recombinant FH19−20 or FHR-11−2 in the presence or absence of Sbi-III-IV. Using an ELISA assay, the ability of FHR-1,−2,−5, FH19−20, or FHR-11−2 to modulate FH binding to a C3b coated surface was studied in the absence (D) or presence of WT Sbi-III-IV (E), or K173A Sbi-III-IV (F). C3 convertase formation in the absence (G) or presence of Sbi-III-IV (H) was assessed by flowing factor B (500 nM) and factor D (100 nM) in the presence of FH (2,000 nM) or FH +FHR-1 (2,000 and 200 nM) or FH+FHR-1&-5 (2,000, 200 and 20 nM) across a surface amine coupled with 500 RU C3b. To form Sbi bound C3 convertase, experiments were conducted in addition of 2,000 nM of Sbi-III-IV. Detailed experimental and data processing procedures are provided in Materials and Methods and Figure S3E. (I) Percentage of intact C3b derived from continuous recording of ANS fluorescence changes between 465 and 475 nm spectrum. Baseline C3b breakdown curve (−) was recorded in the presence of FH and FI, interference caused by the addition of FHR-5 (+) or FHR-5 in combination of Sbi (++) was also examined. The data for FHR-1 and FHR-2 are presented in Figure 3F. Normalized data was depicted in solid lines, simulated breakdown curves were shown as dotted-lines. Each curve represents the mean value of three independent experiments. For (A–F), the mean and standard deviation for each measurement was calculated; For (G–H), each sensorgram is representative of two experiments. For (I), simulated breakdown curves were fitted using one phase exponential decay function in GraphPad Prism.

