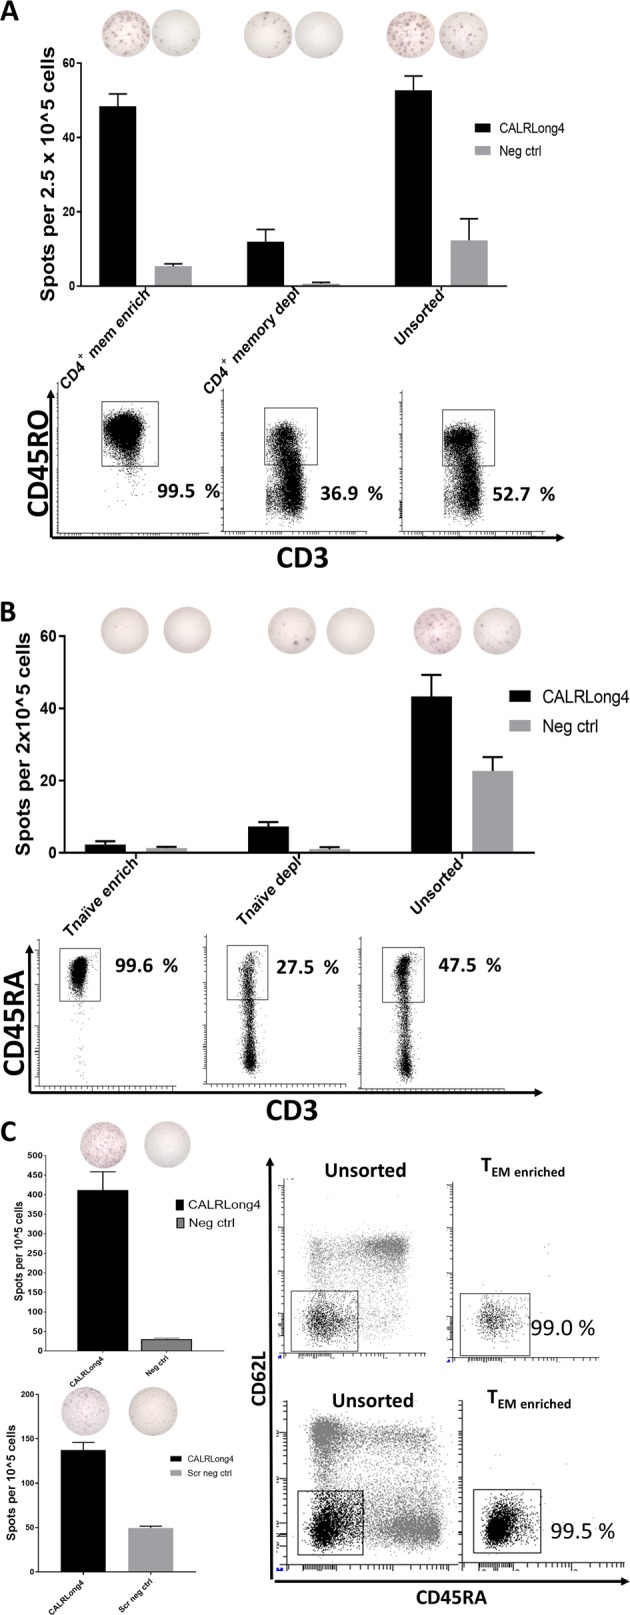
Fig. 4. CALR-mutant-specific T-cell responses in different T-cell compartments.

a PBMCs from healthy individuals were enriched for CD4+ Tmem with MACS. Enriched cells, CD4+ Tmem-depleted cells, and unsorted cells were analyzed in a standard IFN-γ ELISPOT. (Middle) The number of spots per T-cell fraction and (top) a representative photograph of wells stimulated with either CALRLong4 or a negative scrambled peptide. (Bottom) Purity analyses of CD3+ gated cells in corresponding cell fractions. ELISPOT assays were performed in triplicate. b PBMCs from healthy individuals were enriched for Tnaive cells with MACS. Enriched cells, Tnaive-depleted cells, and unsorted cells were analyzed in a standard IFN-γ ELISPOT. (Middle) The number of spots per T-cell fraction; (top) a representative photograph of wells stimulated with either CALRLong4 or a negative scrambled peptide. (Bottom) Purity analyses of CD3+ gated cells in corresponding cell fractions. ELISPOT assays were performed in triplicates. c PBMCs from healthy individuals were enriched for T effector memory cells (TEM) (CD3+, CD45RA-, CD62L−) with FACS, and analyzed in an ex vivo IFN-γ ELISPOT. (Left) The number of spot-forming cells and a representative photograph of wells stimulated with either CALRLong4 or a negative scrambled peptide. (Right) FACS plots of unsorted PBMCs and TEM-enriched fractions show the purity of TEM-enriched fractions in CD3+ gated cells. Error bars display standard error of the mean
