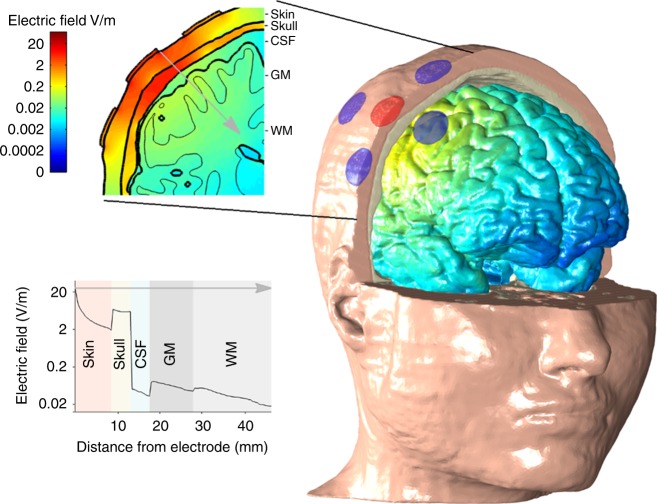
Fig. 1.
Computational model showing the electric field distribution in different tissues. Using a focused montage, 1 mA tACS is applied. The three-dimensional head model shows the electric field distribution over the cortical surface, with color encoding the field magnitude. The color scale is shown in the upper left panel—note that it is logarithmic. The skin and the skull have been partially cut away and the cerebrospinal fluid (CSF) is not shown. tACS electrodes are represented by circles with the anode in red and the cathodes in blue. A two-dimensional coronal, partial, cross-section is shown in the upper left panel. The logarithmic color scale is the same as in the 3D head model. The different tissues represented in the model are indicated—skin, skull, CSF, gray matter (GM) and white matter (WM). A one-dimensional plot of the electric field strength along the position indicated by the gray arrow is shown in the bottom left panel. This shows how the electric field magnitude decreases with distance from the electrode and how it is affected by each tissue type. Again, note the logarithmic scale on the axis showing the electric field. Electric field strengths in the skin can be 20–100 times higher than in the brain

