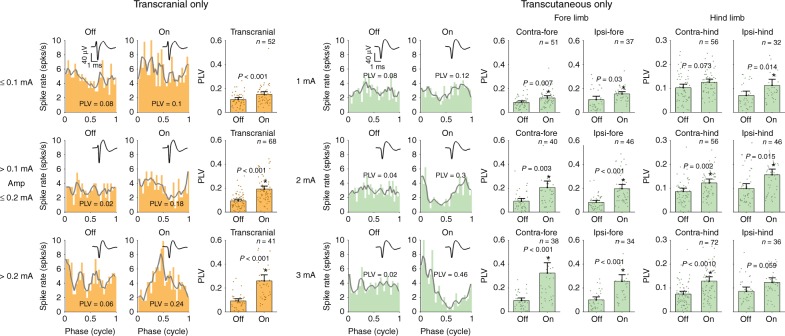
Fig. 3.
Effect of transcranial- and transcutaneous-only stimulation on neural entrainment. The rows show the effect of increasing stimulation amplitude on phase locking value (PLV). The transcranial-only data are grouped into three amplitude ranges: LOW (≤0.1 mA), MEDIUM (>0.1 mA, but ≤0.2 mA), HIGH (>0.2 mA). While the transcutaneous-only data were collected at three fixed amplitudes: LOW (1 mA), MEDIUM (2 mA), HIGH (3 mA). Entrainment increased with increasing amplitude (linear model followed by one-sided Wilcoxon sum rank). As in Fig. 2, the PLV values quantifying the amount of neural entrainment are reported on the example cycle histograms. The bar graphs compare the mean PLV for stimulation OFF and ON for each amplitude condition. Error bars show the confidence intervals. A star indicates that there was a significant increase in neural entrainment from stimulation OFF to ON for that particular condition. For transcutaneous-only stimulation, four different electrode configurations were tested: contralateral (to the 32-channel recording probe) fore, contralateral hind, ipsilateral fore and ipsilateral hind. The fore limb electrode configurations caused more neural entrainment than the hind limb configurations. In general, we found that transcutaneous-only stimulation produces similar patterns of neural entrainment to transcranial-only stimulation. (Wilcoxon signed rank test, one-sided, Bonferroni corrected for transcranial and transcutaneous)

