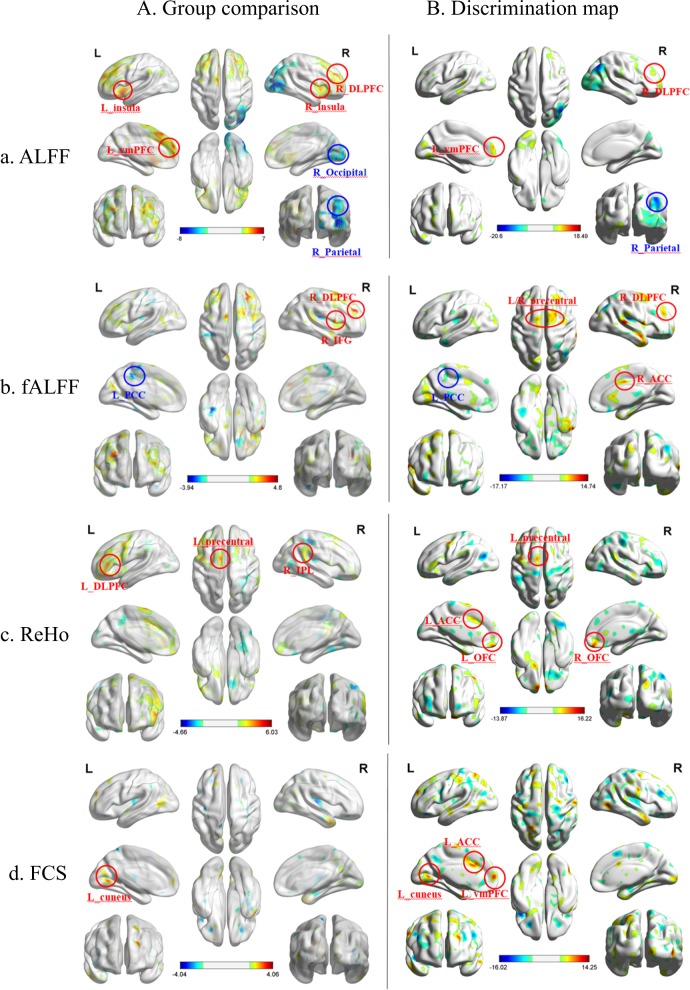
Fig. 1. Significant regions in group comparison and discrimination map.
a ALFF, b fALFF, c ReHo, and d FCS. In group comparison panel, warm colors indicate regions showing higher values in the OCD group than in HCS and cool colors indicate regions showing lower values. The color bar indicates the T-score. Threshold: p < 0.05, false discovery rate-corrected at cluster level (a), p < 0.005, uncorrected at pixel level (b, c, d). In discrimination map panel, warm colors indicate higher values for the parameter in OCD group than in HCS, whereas cool colors indicate higher values for the parameter in HCS than in patients with OCD. The color bar indicates the weighted vector value determined from SVM. OCD obsessive-compulsive disorder, HCS healthy control subjects, SVM support vector machine, ALFF amplitude of low-frequency fluctuations, fALFF fractional amplitude of low-frequency fluctuations, ReHo regional homogeneity, FCS functional connectivity strength

