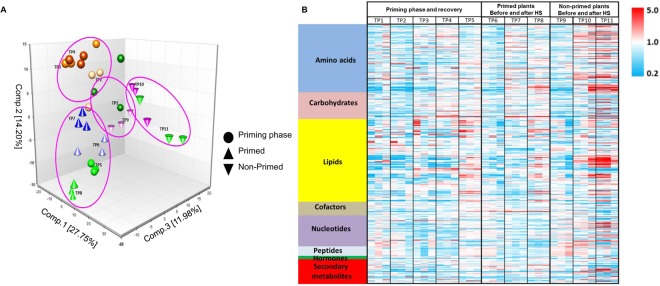
Figure 2.
Principal component analysis (PCA) and global biochemical profiles at different time points and a heatmap based on metabolite abundances. (A) PCA showing group and separation of biochemical profiles between different time points. (B) Heatmap showing relative concentration of metabolites at different time points (TP), Columns represent the different samples, 3 biological replicates per sample. Rows the different compounds, in red more abundant and blue less abundant metabolites. “Heat priming” stands for exposure of plants to gradually increased temperature (primed plants). Non-primed plants are exposed to sudden heat shock treatment.

