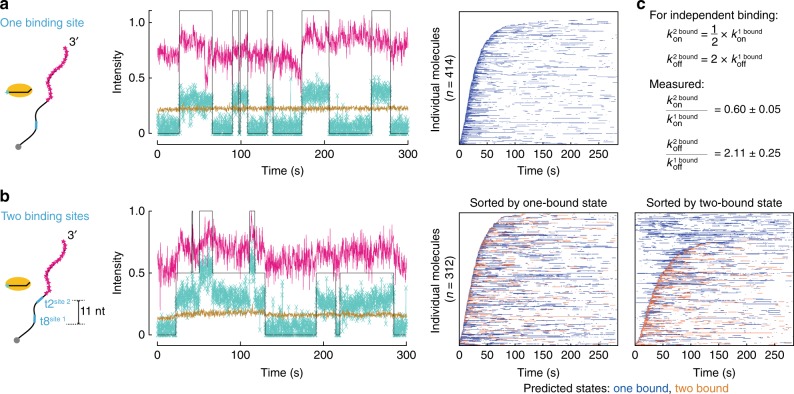
Fig. 2.
DNA-guided TtAgo binds independently to DNA targets containing two adjacent seed-matched t1G sites. Representative fluorescence intensity time traces of TtAgo (turquoise) binding DNA target (magenta) containing one binding site (a) or two binding sites spaced 11 nt apart from t8 to t2 (b). Light brown indicates background levels of green fluorescence, whereas the black line denotes binding events detected by the pipeline after VBEM-MGHMM analysis. Fluorescence intensity is expressed in thousands of photons. Representative rastergrams summarize traces of individual target molecules, each in a single row and sorted according to their arrival time. c Comparison of kon and koff of DNA-guided TtAgo with targets containing one or two binding site(s). Values are reported as mean ± standard deviation for three independent replicates

