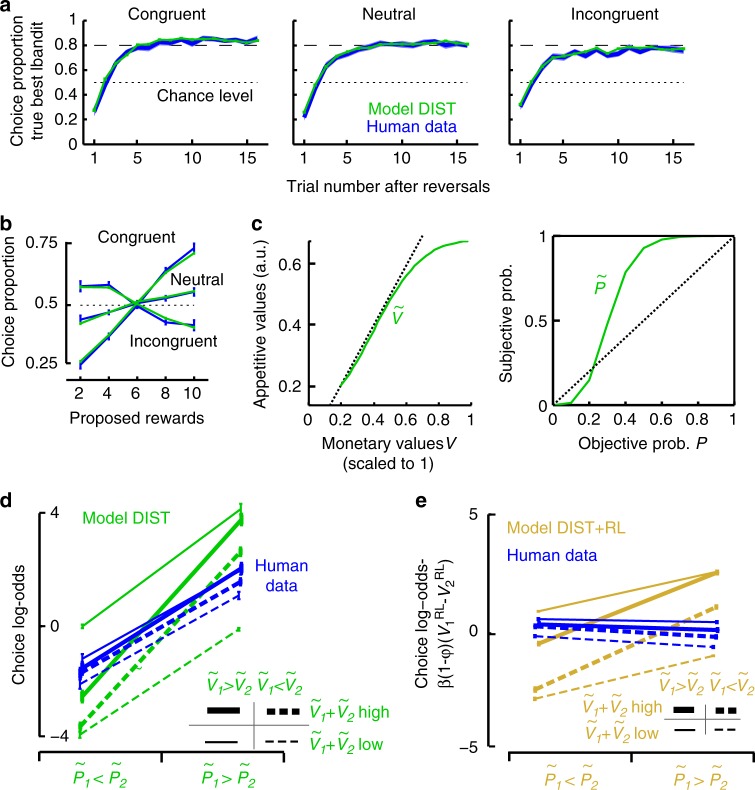
Fig. 2.
Model DIST fit to human performances. a Proportions of choosing true best bandits (maximising reward frequencies x proposed rewards) following reversals. b Proportions of choosing proposed rewards. In a and b, mean proportions are shown in the congruent, neutral and incongruent condition for fitted model DIST (green) and participants (blue, ±s.e.m.). See Supplementary Fig. 1 for (parameterised) model OPT fit. c Appetitive values of proposed monetary rewards (left) and subjective probabilities in inferred bandits’ reward probabilities (right) in model DIST fitting human choices (lines correspond to distortion functions with mean parameters over participants). d Factorial analysis of choice log-odds over trials sorted according to subjective probabilities , appetitive values of proposed rewards and total appetitive values (, median split) for fitted model DIST simulations (green) and human data (blue). Both model DIST and participants exhibited main effects of subjective probabilities and relative appetitive values (all Fs(1,21) > 23.7, ps < 0.00001) with no main effects of total appetitive values (both Fs < 1). However, model DIST unlike participants exhibited an interaction between subjective probabilities and total appetitive values (DIST: F(1,21) = 2269, p < 0.00001. participants: F < 1). e Same factorial analysis of choice log-odds adjusted for RL-values for fitted model DIST+RL and human data (see text). Model DIST+RL exhibited main effects of subjective probabilities, relative appetitive values and total appetitive values (all Fs(1,21) > 7.8, ps < 0.01), along with an interaction between subjective probabilities and total appetitive values (F(1,21) = 691, p < 0.00001). By contrast, participants exhibited only a main effect of relative appetitive values (F(1,21) = 18.5, p < 0.0001): participants exhibited no main effects of subjective probabilities (F(1,21) = 3.0, p = 0.10), and neither main nor interaction effects associated with total appetitive values (both Fs(1,21) < 1.2, ps > 0.29). See Supplementary Table 1 for model best-fitting parameters and Supplementary Fig. 2 for model-free analysis. Error bars are s.e.m. over participants (N = 22)

