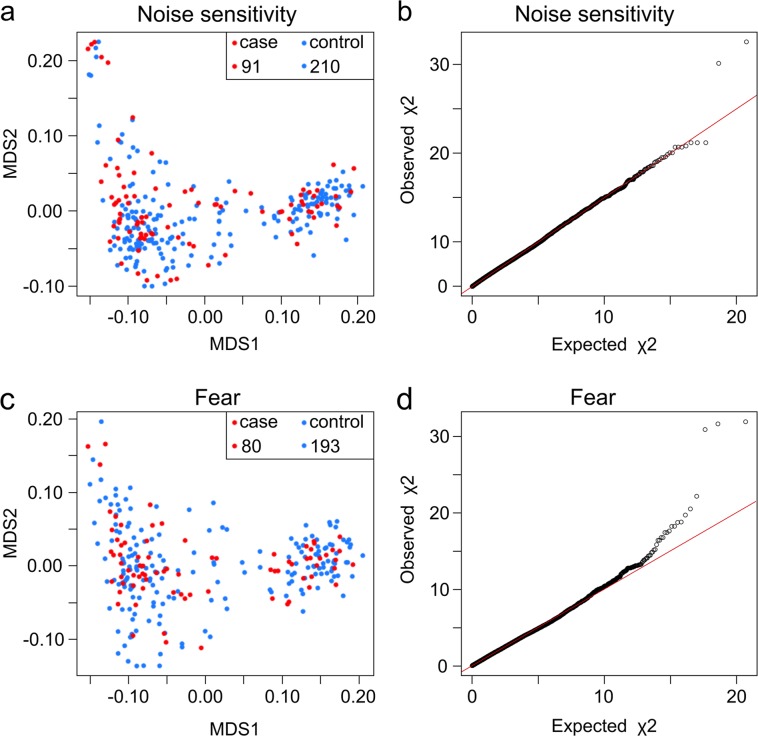
Fig. 2. Multidimensional scaling and quantile–quantile plots for the NS and fear cohorts.
a MDS plot for NS b q–q plot for NS (λ = 1.022). c MDS plot for fear. d q–q plot for fear (λ = 1.020) The study cohorts include show and working line German Shepherds, which are seen in separate genetic clusters. Working line dogs are grouped on the left side of the plot while show line dogs are seen on the right, with dogs with a mixed heritage in the middle

