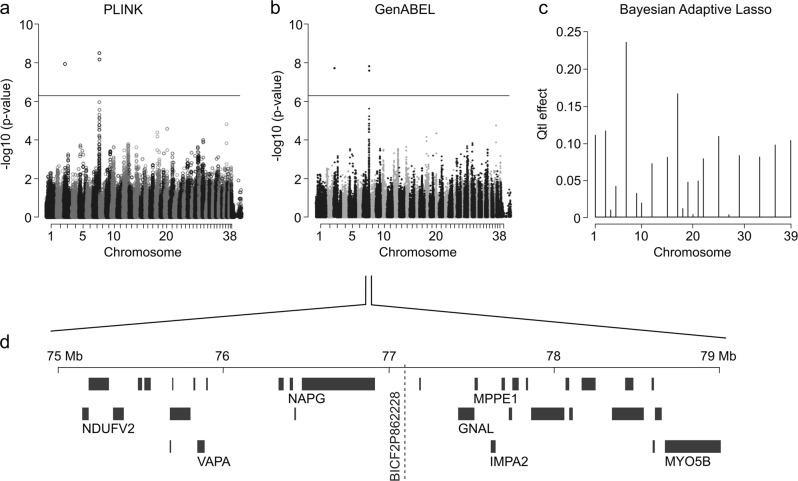
Fig. 5. GWAS for fear.
a A single-locus-analysed Manhattan plot (PLINK) indicates best p-values at chromosome 7 in a genome-wide analysis. b A Manhattan plot of a mixed model association analysis (GenABEL) indicates best p-values at chromosome 7 in a genome-wide analysis. c An Extended Bayesian Lasso method indicates the best signal (posterior QTL-effect) in chromosome 7. d The associated genomic region is syntenic to the human 18p11.2 locus that has been associated with various psychiatric disorders

