Figure 4.
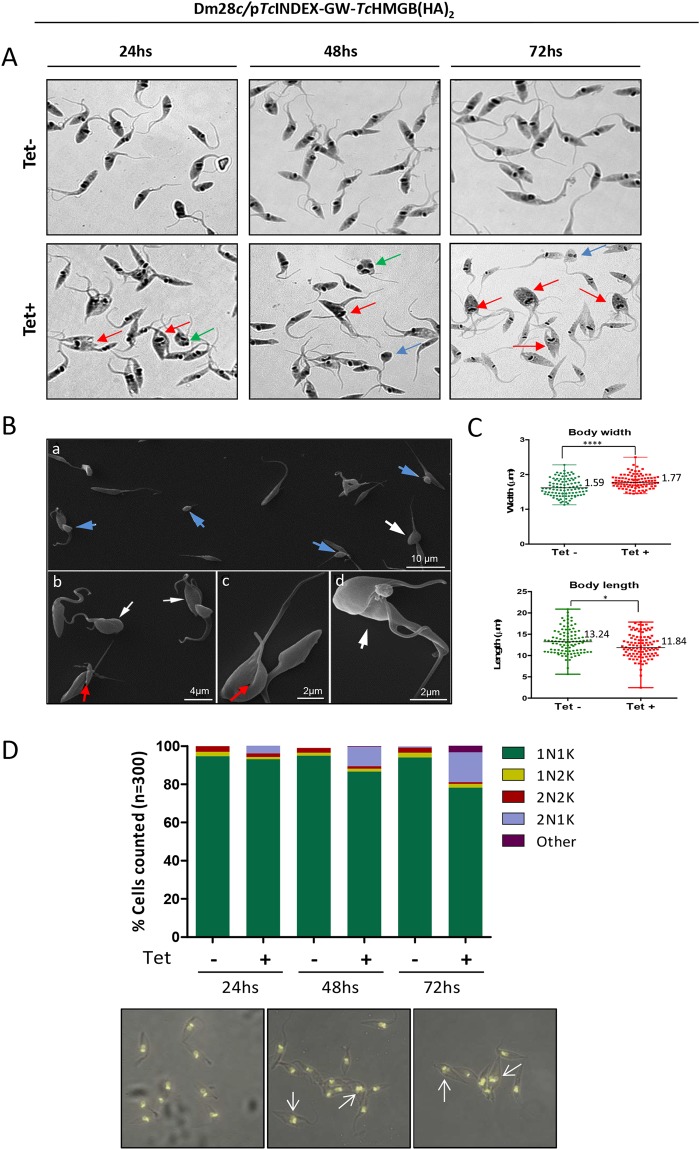
TcHMGB overexpression affects cell morphology and division. (A) May Grünwald Giemsa-stained T. cruzi Dm28c/pTcINDEX-GW-TcHMGB(HA)2 epimastigotes in the absence (−) or presence (+) of Tet at 24, 48 and 72 h post-induction. Red arrows indicate parasites with apparent impaired cytokinesis. Some of them present altered cell morphology for example, two nuclei and one kinetoplast (green arrows) and reduced sizes (blue arrows). (B) Images obtained by Scanning Electron Microscopy (SEM) showed that the induction of TcHMGB overexpression promoted the appearance of cells with reduced sizes (panel a, blue arrows) and a high number of parasites in cytokinesis, presenting an enlargement or widening of the cell body (white arrows). Some cells presented an asymmetric division (panels b and c, red arrows), which can generate parasites with reduced sizes (panel a, blue arrows). (C) Analysis of the parasite body dimensions. The body widths and lengths of control (Tet−) and induced (Tet+) epimastigotes were measured from the SEM images. Wilcoxon-Mann-Whitney Test confirmed that the values for width and length between the (Tet−) and (Tet+) groups are significantly different (p < 0.05), N = 101, Dot plot graphs represent individual values, median and range are indicated; *p < 0.05, ****p < 0.0001. (D) Nucleus/Kinetoplast content (N/K) of Dm28c/pTcINDEX-GW-TcHMGB(HA)2 epimastigote cultures in the absence (Tet−) or presence (Tet+) of tetracycline at different time points (24, 48 and 72 hours). Data from two independent experiments were considered in the analysis (n = 300 cells for each column). Below, representative pictures of the microscopy images analyzed to perform the graph. White arrows show examples of epimastigotes with 2 segregated nuclei and 1 kinetoplast (2N1K).

