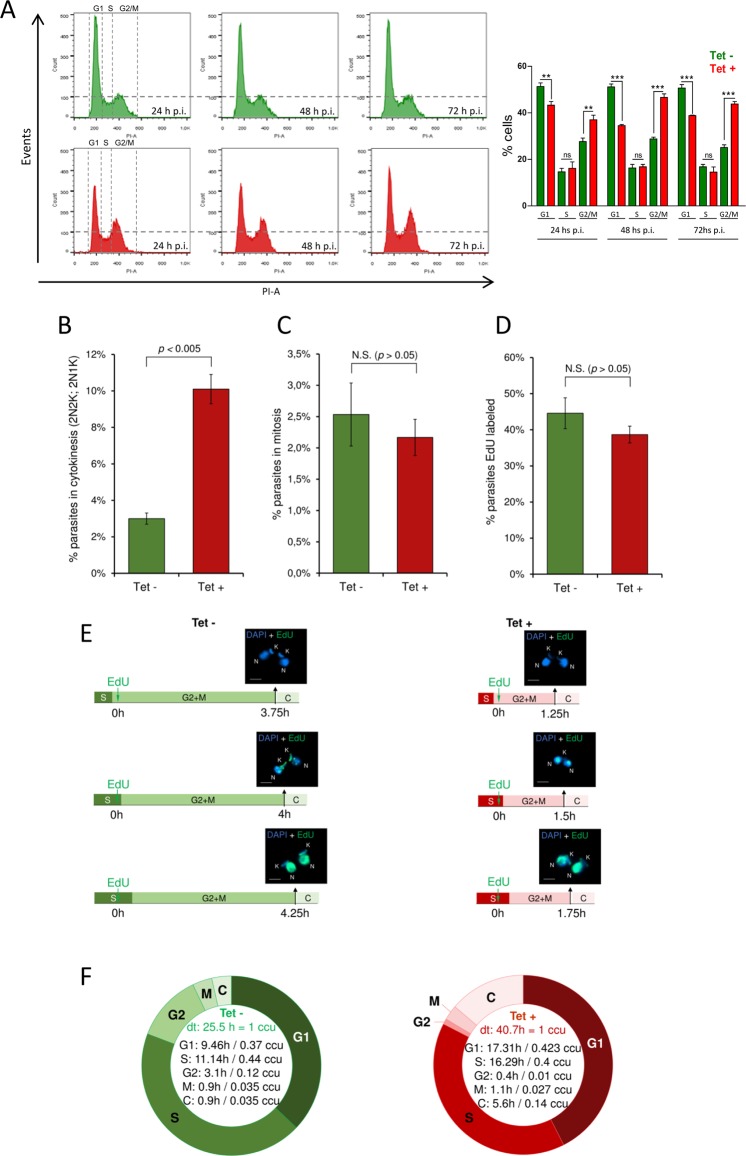
Figure 5.
TcHMGB overexpression alters cell cycle progression. (A) Flow Cytometry analysis of the cell cycle progression. On the left, Flow Cytometry analysis of cultured T. cruzi Dm28c/pTcINDEX-GW-TcHMGB(HA)2 epimastigotes at different times post-tetracycline induction (p.i.). Histograms are plotted as number of events vs. propidium iodide absorbance (PI-A). On the right, bar graph with the percentages of cells in the different phases of the cell cycle. **p < 0.005, ***p < 0.0001 (Student t test). (B–F) Estimation of the duration of each cell cycle phase. T. cruzi Dm28c/pTcINDEX-GW-TcHMGB(HA)2 epimastigotes in exponential phase of culture induced (Tet+) or not (Tet−) with tetracycline, were used in these analysis. (B) DAPI-labeled parasites (2N2K and 2N1K) were used to measure the percentage of parasites in cytokinesis, which was estimated to be 3.0% ± 0.3 for Tet− group (green) and 10.1% ± 0.8 for Tet+ group (red). Error bars represent SD. The values shown represent the average of three independent assays. These values were used in Williams (1971) equation to estimate the duration of cytokinesis phase. (C) Parasites with nuclei in division but not yet segregated were used to estimate the proportion of parasites performing mitosis [2.5% ± 0.5 for Tet− (green), and 2.2% ± 0.2 for Tet + (red)]. Error bars represent SD. The values shown represent the average of three independent assays. These values were used in Williams (1971) equation to estimate the duration of mitosis phase. (D) Parasites EdU-labeled after 1 h of EdU pulse were used to estimate the percentage of parasites replicating DNA [44.6% ± 4.3 for Tet– (green), and 38.7% ± 2.3 for Tet+ (red)]. Error bars represent SD. The values shown represent the average of three independent assays. These values were used in Stanners and Till (1960) equation to estimate the duration of S phase. (E) To estimate the duration of G2 + M phases, the thymidine analog EdU was added to the culture and parasites were collected every 15 min until parasites containing two EdU-labeled nuclei were observed (2N2K or 2N1K). In Tet– (green), this pattern was observed after 4 h, and in Tet + (red) after 1.5 h. This assay was carried out in triplicate and in all of them, we found a parasite containing two EdU-labeled nuclei at the same time. The scale bar on the fluorescence images corresponds to 2 µm. (F) Schematic representation showing the duration of each cell cycle phase established using EdU. Of note, ccu means cell cycle unit, where one unit corresponds to the specific doubling time (dt) for each strain. The statistical analysis for Fig. 5B-D was made with Student t test using GraphPad Prism 6. As expected, the significant statistical difference (comparing Tet− and Tet + ) relative to parasites performing cytokinesis (Fig. 5B) is reflected in the cytokinesis phase lengths estimated for both Tet− and Tet + (Fig. 5F). Of note, there was no significant statistical difference between parasites EdU-labeled or parasites performing mitosis (p > 0.05).

