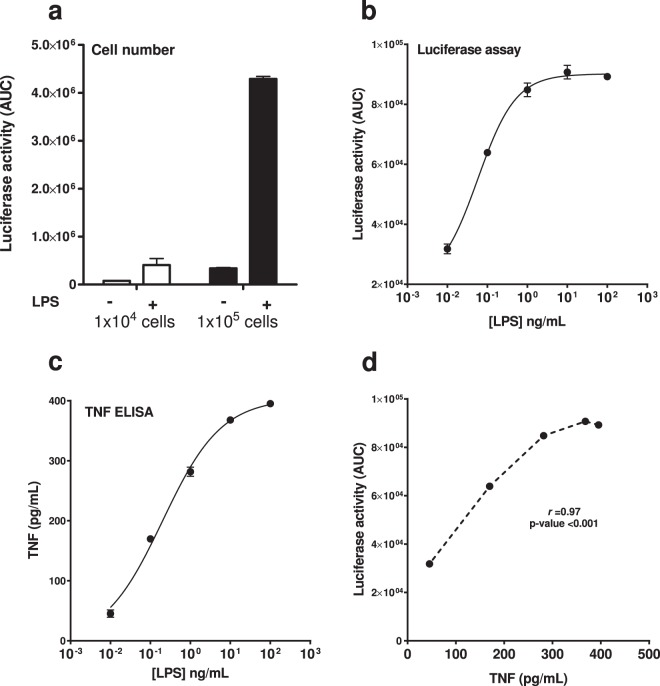
Figure 5.
Correlation of LPS-induced luciferase activity with endogenous TNF secretion. Effect of BMDM cell number on 10 ng/mL LPS-induced luciferase activity; 1 × 10⁴ cells (white bars) and 1 × 10⁵ cells (black bars) (a). Luciferase activity in hTNF.LucBAC BMDMs stimulated with increasing levels of 0.01–100 ng/mL LPS (b). Soluble TNF in the supernatant of treated cells 24 h post-stimulation (c). Pearson’s coefficient of correlation (r) was calculated to assess association between TNF with activity of luciferase represented as area under the curve (AUC) (d). Data are representative of three independent experiments, with triplicate cultures per experiment (N = 3, n = 3) and bars represent standard error of the mean.

