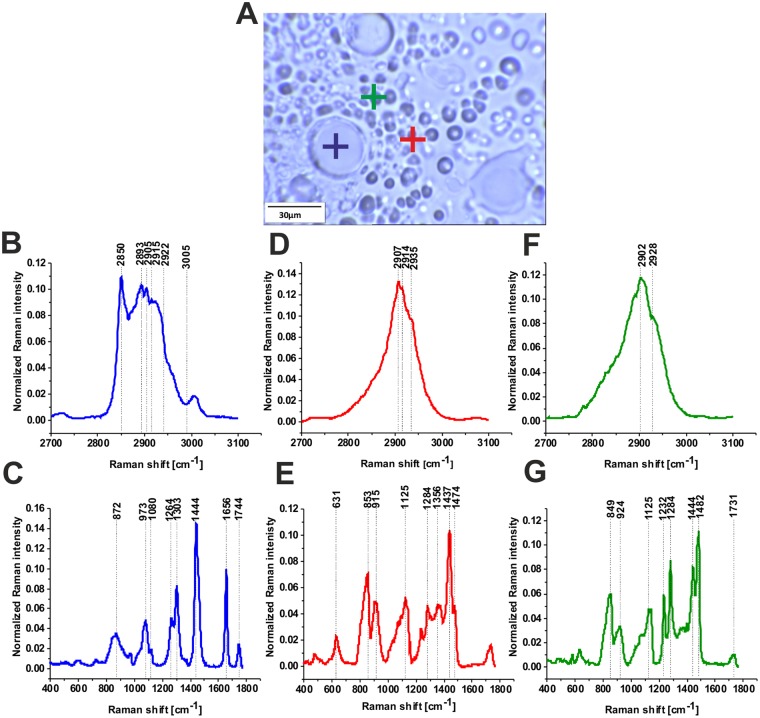
Figure 4.
Typical vibrational Raman spectra in normal breast tissue from the tumor margin (for the same patient P157 as in Fig. 3), lipid-rich region (blue cross) and glycan-rich regions (red and green cross) in the white light microscopy image (A)) in the high frequency (B,D,F) and in the fingerprint (C,E,G) spectral regions of human breast normal tissue, integration time for a single spectrum 2 s, 10 accumulations, laser power 10 mW, patient P157.

