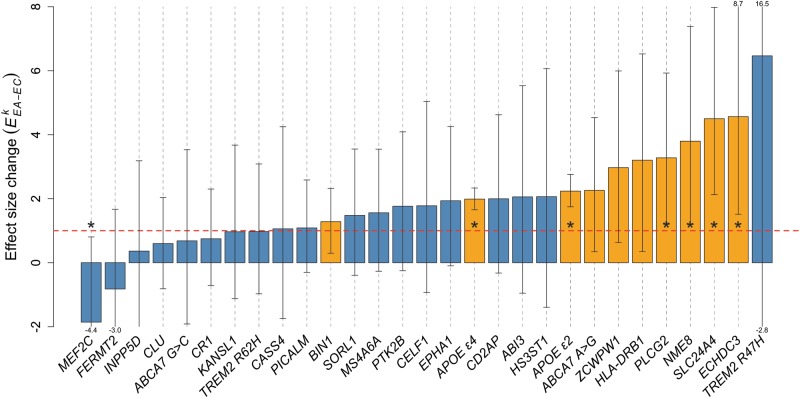
Fig. 2.
Change in variant effect-size using extreme cases and centenarian controls relative to published effect-sizes, for 29 AD associated genetic variants. Dashed red line at EkEA−EC = 1 indicates same effect-size as reported in literature. Orange bars indicate nominal statistical significance for the association with AD (p < 0.05). Stars indicate significant changes of effect-size relative to previously reported effect-sizes (p < 0.05, two-sample z-test)

