Fig. 1.
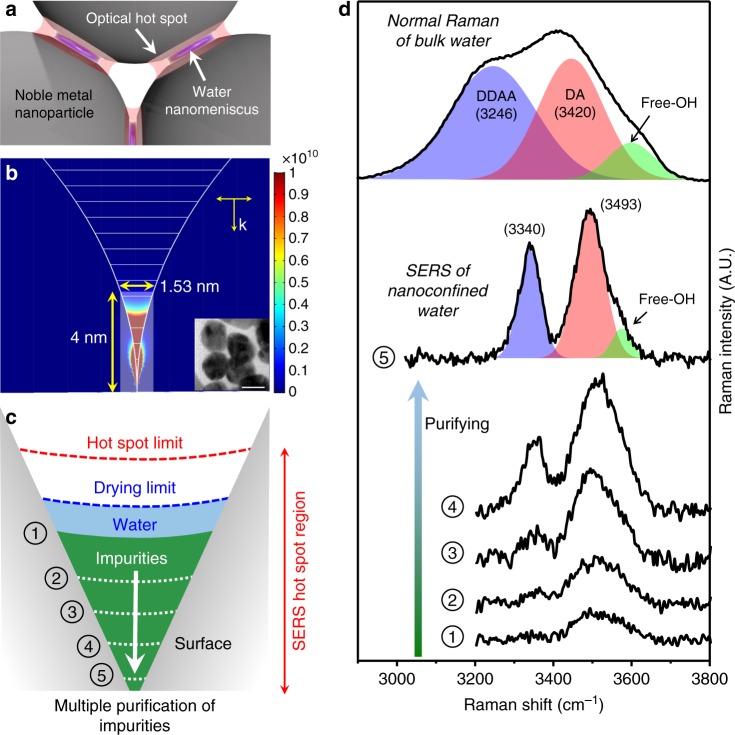
SERS for trace amounts of ultra-purified nanoconfined water. a Schematic showing the trapped water nanomeniscus in the optical hot-spot region after the highly purified silver nanoparticles (with the surface capped-citrate removed) are dried in ambient conditions. b Finite element method-based simulation of the electromagnetic fields shows that the field-enhanced region (or the SERS hot-spot) is highly localized at the crevice of silver dimer where nanoconfined water is formed. Here, the vertical scale represents the electromagnetic field enhancement (= |scattered field/incident field|4). Inset shows the transmission electron micrograph (20 nm scale bar). c Schematic of the SERS hot-spot obtained by progressive purification. The hot-spot limit denotes the maximum optical region where most Raman signal comes from, while the drying limit indicates the maximum spatial region where nanoconfined water forms after drying. Stage 1 corresponds to the condition where most water is excluded from the hot spot due to the unremoved impurities remaining at the crevice, while stage 5 presents the situation where water occupies mostly the hot spot. d Spectra (1–5) show the increasingly prominent SERS signal of nanoconfined water as purification progresses, in contrast to the normal Raman of the bulk water (black curve, top) that shows three OH-stretching bands for the hydrogen bonding (HB) configuration; DDAA (D: HB donor, A: HB acceptor), DA and free-OH (for simplicity, negligible effects of DAA and DDA bands are omitted)

