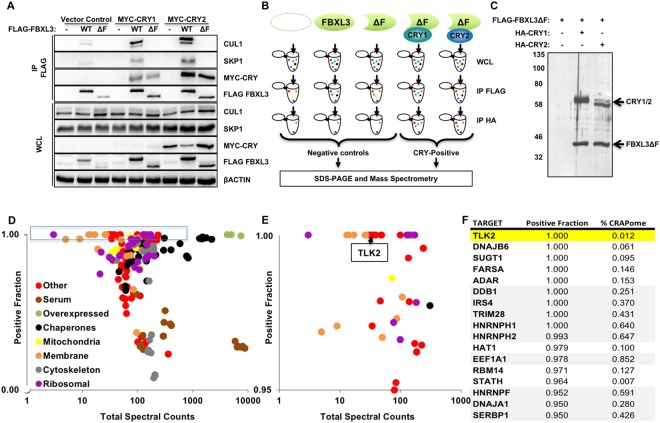
Figure 1.
Unbiased screen for FBXL3 partners recruited by CRY1 and/or CRY2. (A) CUL1, SKP1, βACTIN, MYC-CRY1, MYC-CRY2, FLAG-FBXL3 detected by immunoblot (IB) in whole cell lysate (WCL) or following immunoprecipitation (IP) of FLAG tagged proteins from cells transiently expressing the indicated plasmids. (B) Screening conditions and workflow. (C) Proteins detected by silver stain in samples prepared as shown in (B). Molecular weight markers (kDa) at left. Uncropped gel in Supplementary Fig. 4. (D) Each symbol represents one of 141 proteins for which at least 30 peptides were detected in CRY-positive samples. Colors denote association with subcellular compartments or protein complexes as indicated. (E) Magnified view of the data in the blue rectangle in (D). (F) List of top candidates from the screen, with TLK2 highlighted in yellow. Gray shading indicates proteins frequently detected my mass spectrometry in Flag IPs from 293 T cells. In (D,E) Total spectral counts indicates the number of peptides detected in all samples in all three experiments combined. Positive fraction indicates the number of peptides detected in CRY-positive samples divided by the number detected in all samples.

