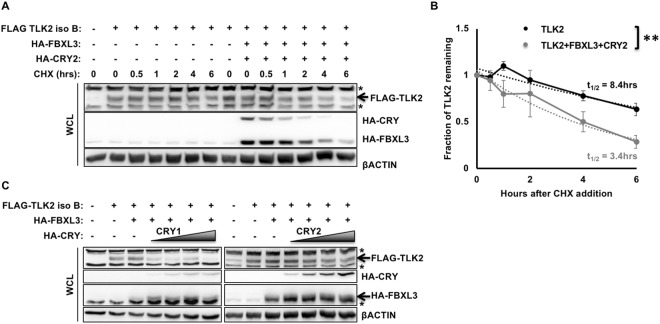
Figure 3.
CRY1/2 and FBXL3 affect TLK2 stability. (A,C) Proteins detected by IB in WCL or following FLAG IP from 293 T cells expressing the indicated plasmids and following treatment with CHX for the indicated times. In (C) shaded triangles indicate increasing HA-CRY1 or HA-CRY2 expression. * denotes non-specific signal. (B) Quantitation of IB data from three experiments as shown in (A). Each data point represents the mean ± s.e.m. of the signal for FLAG-TLK2 overexpressed alone (black) or with overexpressed FBXL3 + CRY2 (gray) divided by the signal for βACTIN from the same sample, normalized to the sample collected before addition of CHX (t = 0). The dotted lines represent the best exponential fit to each data set, from which the half-lives were calculated according to the formula t1/2 = Tln(2), where T is derived from the exponential fit equation N(t) = N0exp(−t/T). **P < 0.01 by two-way ANOVA.

