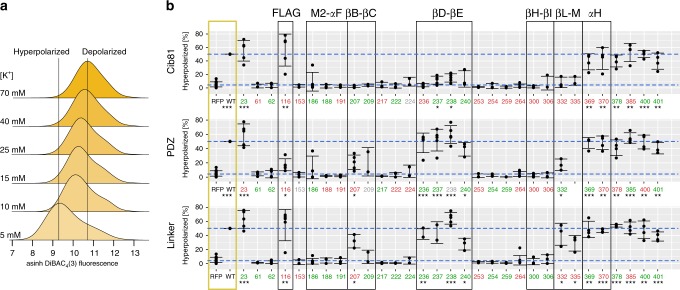
Fig. 5.
Domain insertion impact on Kir2.1 function. a Stacked histograms of population-level DiBAC4(3) fluorescence (hyperbole arcsine transformed) in HEK293FT cells expressing WT Kir2.1 as a function of external K+ (concentration indicated on the left). Increasing K+ depolarizes the cells, resulting in less membrane partitioning of the dye, thus increasing measured fluorescence. b The percentage of hyperpolarized cells expressing the indicated Kir2.1 variant and inserted domain are shown. Permissibility (Fig. 2) of that variant is indicated in color (green, permissive; red, nonpermissive; gray, no data). Higher percentage of hyperpolarized cells indicates function, and lower percentage of hyperpolarized cells indicates disruption. Reference measurements are provided for HEK239FT expressing miRFP670 alone and WT Kir2.1 co-expressed with miRFP670 (yellow box). Reference levels of WT and no channel are indicated by blue dashed lines. Replicates for insertion mutants are plotted with bars representing standard deviations and centered at the mean (each insertion variant n = 3–5, wild-type n = 21, and RFP670 n = 14). Significance of differences for means of each variant and WT with respect to channel (RFP) was tested using a one-sided t test. Significance levels are ***P < 0.001, **P < 0.01, and *P < 0.05, respectively. Variants without a mark are not significant. Regions discussed in the text are indicated by black boxes

