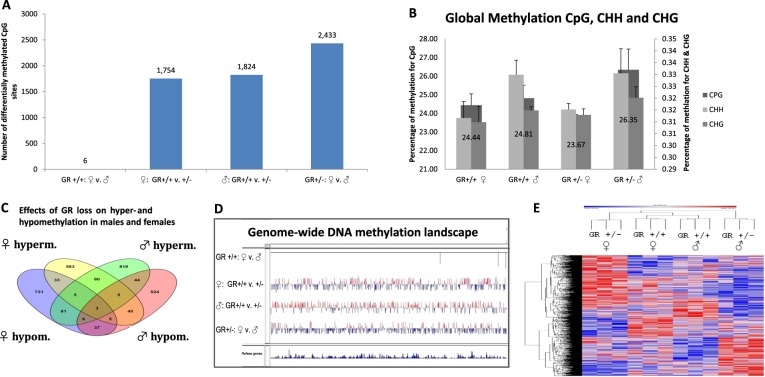
Fig. 2. Sex-dependent effects of Nr3c1 deficiency.
a Number of differentially methylated CpG sites for the comparisons of female vs male Nr3c1+/+, female Nr3c1+/+ vs female Nr3c1+/−, male Nr3c1+/+ vs Nr3c1+/−, and female vs male Nr3c1+/− as depicted in the x-axis. Numbers directly above the graph bars represent absolute numbers of differentially methylated CpG sites. b Global methylation of CpG, CHH, and CHG sites in wildtype and Nr3c1 knockouts in both sexes. Numbers depicted directly on the graphs represent the percentage of CpG sites (see also y-axis to the left). The percentage of CHH and CHG sites are illustrated on the right y-axis. c Effects of Nr3c1 loss on hyper- and hypomethylation in males and females. d Genome-wide methylation tracks for CpG sites using Integrative Genomics Viewer (Broad Institute). Comparison is shown for female vs male wildtype, female wild type vs female Nr3c1 heterozygous, male wild type vs male Nr3c1 heterozygous, and male vs female Nr3c1 heterozygous animals. e DNA methylation landscape of Nr3c1 deficiency in male and female placental DNA. Heatmap (row distance metric: Pearson correlation, average linkage) depicting the clustering of 6017 CpGs that were differentially methylated (q < 0.2) between placentae of Gr+/+ and Gr+/− fetuses of both sexes. Rows correspond to CpGs and columns to animals’ genotype and sex. Here, group number 1–3 indicates three pooled samples of Gr+/+ males, number 4–6 stands for three pooled samples of Gr+/− males, 19–21 for three pooled samples of Gr+/+ females, and 22–24 for three pooled samples of Gr+/− females. Red indicates higher methylation in a row and blue indicates lower methylation. See also Table S4-S9

