Figure 1.
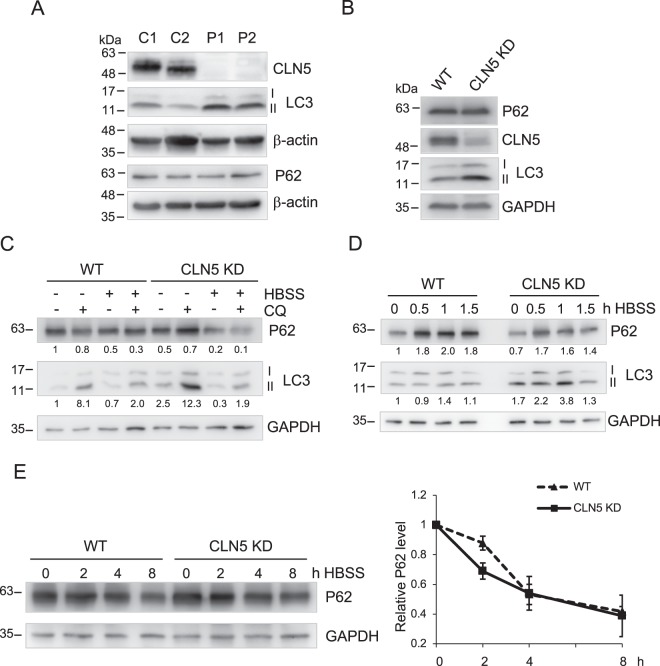
Autophagy is enhanced in CLN5-deficient cells. (A) Total lysates of two healthy control fibroblasts (C1 and C2) and two CLN5 disease patient fibroblasts (P1 and P2) were analyzed by immunoblotting. Basal levels of autophagic markers LC3-II and P62 were shown. The CLN5 was absent in patient cells. (B) Total lysates of WT and stable CLN5 KD HeLa cells were analyzed by immunoblotting. The CLN5 was greatly reduced in CLN5 KD cells. Basal levels of autophagic markers LC3-II and P62 were shown. (C) WT and Stable CLN5 KD HeLa cells were treated with CQ, HBSS, or HBSS + CQ for 4 h. Samples were analyzed by immunoblotting. The relative amounts of LC3-II and P62 after normalization with GAPDH are indicated. (D) WT and Stable CLN5 KD HeLa cells were incubated with HBSS for 0, 0.5, 1, 1.5 h. Samples were analyzed by immunoblotting. The relative amounts of LC3-II and P62 after normalization with GAPDH are indicated. (E) WT and Stable CLN5 KD HeLa cells were incubated with HBSS for 0, 2, 4, 8 h in the presence of cycloheximide and bortezomib. Samples were analyzed by immunoblotting. For degradation quantification on the right (N = 3), P62 was normalized with GAPDH signal in each lane. 0 h in each cell line was set as 1. Error bar represents SEM. β-actin and GAPDH were blotted as loading controls. All experiments were repeated at least three times.

