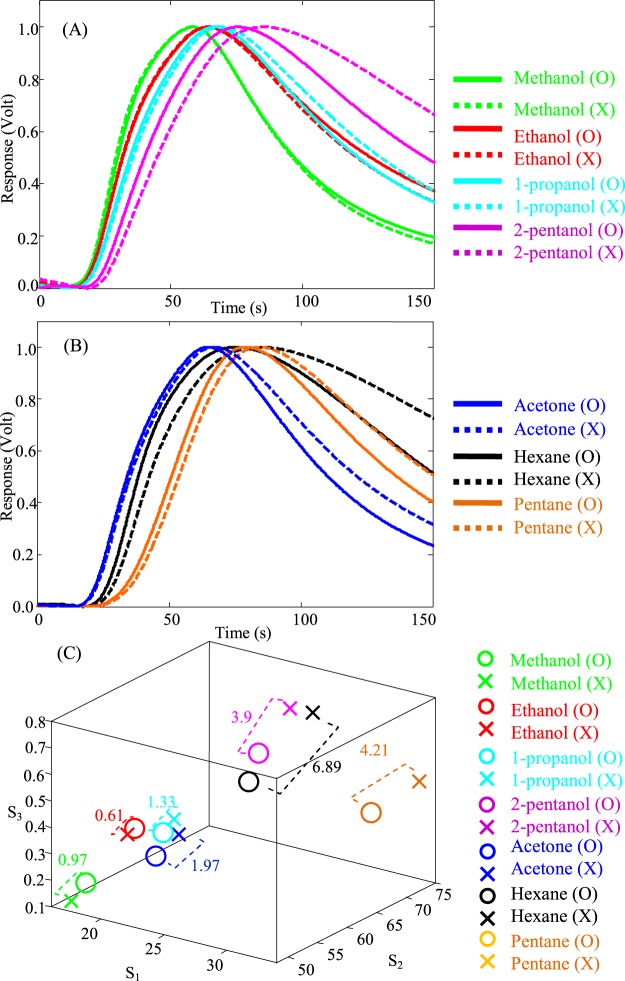
Figure 2.
(A) The normalized transient responses of the Detector O (solid lines) and the Detector X (dash lines) to 1000 ppm of methanol (green), ethanol (red), 1-propanol (cyan), 2-pentanol (magenta). (B) The normalized transient responses of the Detector O (solid lines) and the Detector X (dash lines) to 1000 ppm of acetone (blue), pentane (orange), hexane (black). (C) The feature space presentation for the Detector O (shown with O markers) and Detector X (shown with X markers) for 7 tested analytes.

