Fig. 4.
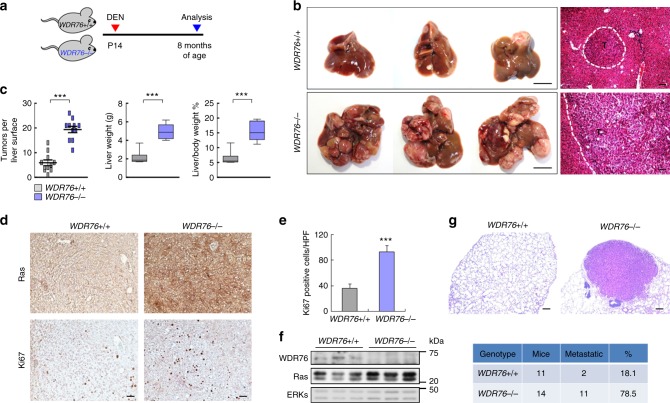
WDR76 deficiency results in Ras accumulation in liver and promotes DEN-induced HCC. a Schematic representation of DEN-induced HCC model. Two-week-old WDR76+/+ and WDR76−/− mice were intraperitoneally injected with DEN and euthanized after 8 months. b Representative gross images (left; scale bars, 10 mm) and H&E staining (right; scale bars, 200 µm) of liver tissues of WDR76+/+ and WDR76−/− mice described in (a). “T” denotes tumor, encircled by the dotted line. c Boxplots show the numbers of visible tumors on the liver surface, liver weights, and liver-to-body weight ratios (n = 11 WT and 11 KO). Data are presented as the mean ± SEM. Statistical significances were assessed using two-sided Student’s t test, ***p < 0.001. d IHC analyses for Ras and Ki67 in WDR76+/+ and WDR76−/− liver tumor sections. Scale bars, 100 µm. e Quantification of the number of Ki67-positive cells per 10 high power field (HPF) in liver tissue sections. Data are presented as the mean ± SD. Statistical significances were assessed using two-sided Student’s t test, ***p < 0.001. f IBs of Ras and ERKs from liver tissues of WDR76+/+ and WDR76−/− mice. g H&E images (top) and numbers (bottom) of lung metastases from WDR76+/+ and WDR76−/− mice given DEN at P14. Scale bars, 500 µm

