Fig. 5.
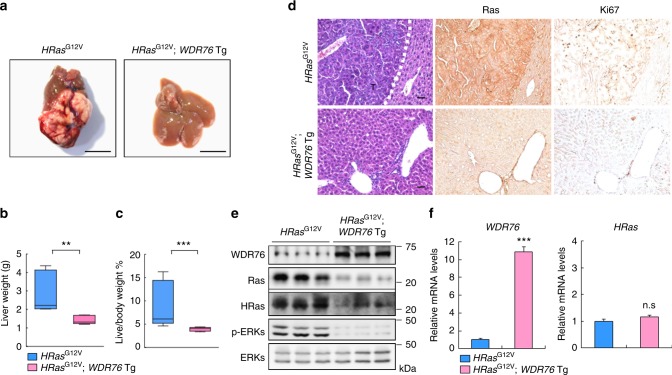
Liver-specific WDR76 inductions suppresses oncogenic HRas-driven hepatic carcinogenesis. a Representative gross images of livers from HRasG12V and HRasG12V/WDR76 Tg mice. Scale bars, 10 mm. b, c Boxplots show liver weights (b), and liver-to-body weight ratios (c) (n = 6 HRasG12V and 6 HRasG12V/WDR76 Tg). Data are presented as the mean ± SEM. Two-sided Student’s t test, **p < 0.01, ***p < 0.001. d–f IHC (d), IB (e), and quantitative RT-PCR (f) analyses of liver tissues from 52-week-old HRasG12V and HRasG12V/WDR76 Tg mice. Scale bars, 100 µm. f Data are presented as the mean ± SD (n = 4 biological replicates). Statistical significances were assessed using two-sided Student’s t test, ***p < 0.001

