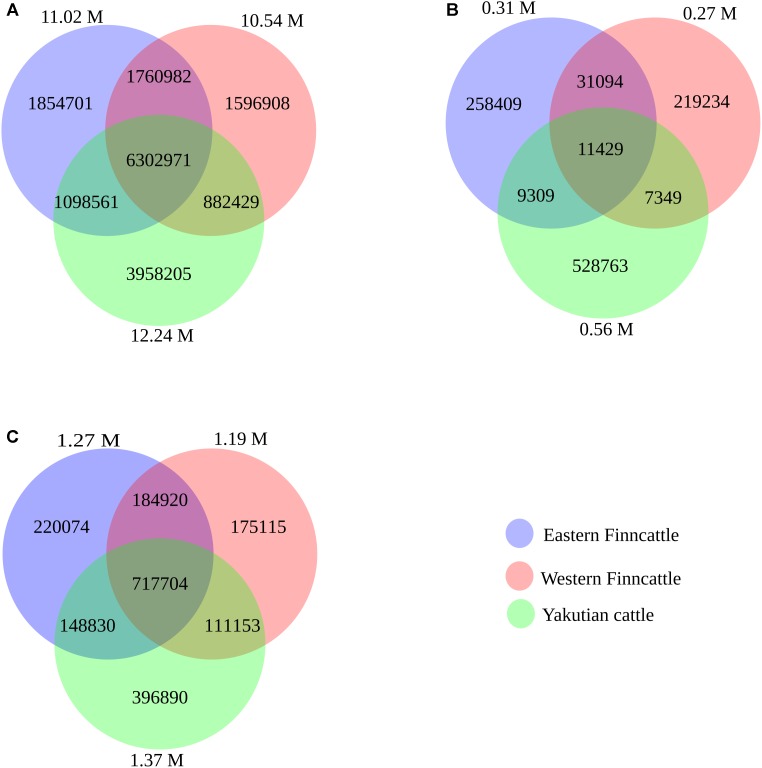
FIGURE 2.
Venn diagram showing overlapping and unique SNPs/indels between the three breeds (Eastern Finncattle, Western Finncattle, and Yakutian). The numbers in parentheses outside the circles are the total number of detected SNPs from each breed. The numbers in the circle components show specific SNPs for each breed or overlapping SNPs/indels between any two breeds or among three breeds. (A) The identified shared and specific SNPs for each breed, (B) the identified shared and specific novel SNPs for each breed, and (C) the identified shared and specific indels for each breed.

