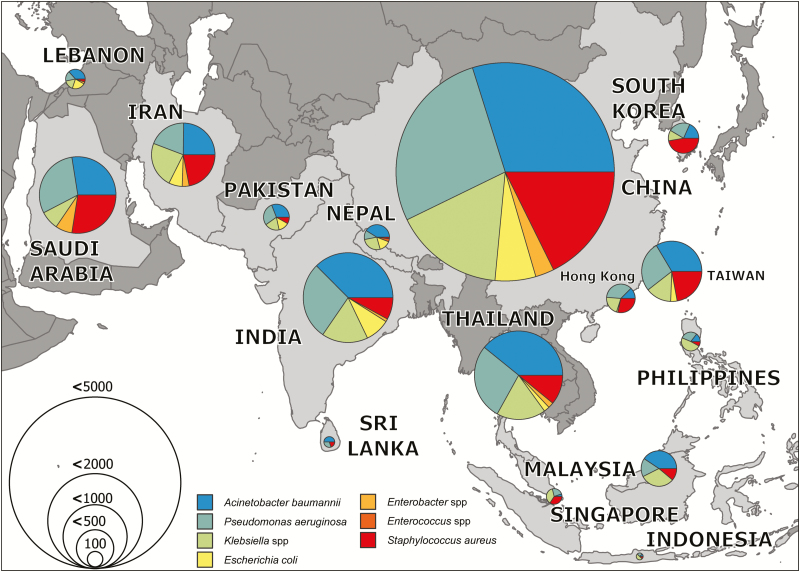
Figure 4.
Mapped pooled microbiology results by country for etiology of ventilator-associated pneumonia. Organisms are color coded, and the size of the pie chart reflects the total number of isolates identified per country. Source: http://naturalearthdata.com.

