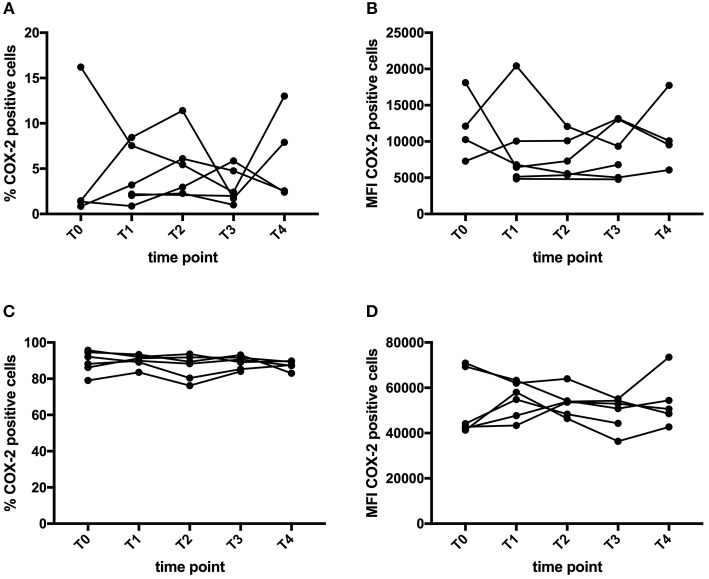
Figure 3.
Effect of curcumin supplementation on COX-2 expression. COX-2 expression in PBMC was determined by flow cytometry. The graphs show the expression in the monocyte (CD14+) gate, either expressed as percentage of cells expressing COX-2 (A,C) or as MFI of COX-2 expression levels (B,D). (A,B) Show the expression of COX-2 in PBMC directly after thawing, while (C,D) show COX-expression levels after a 5h-in vitro culture period in the presence of LPS. Each line depicts one patient. Time points are as follows: T0-baseline, T1-day 1 of treatment, T2-day 7 of treatment, T3-day 14 of treatment, T4, 1 week after last CP dose.

