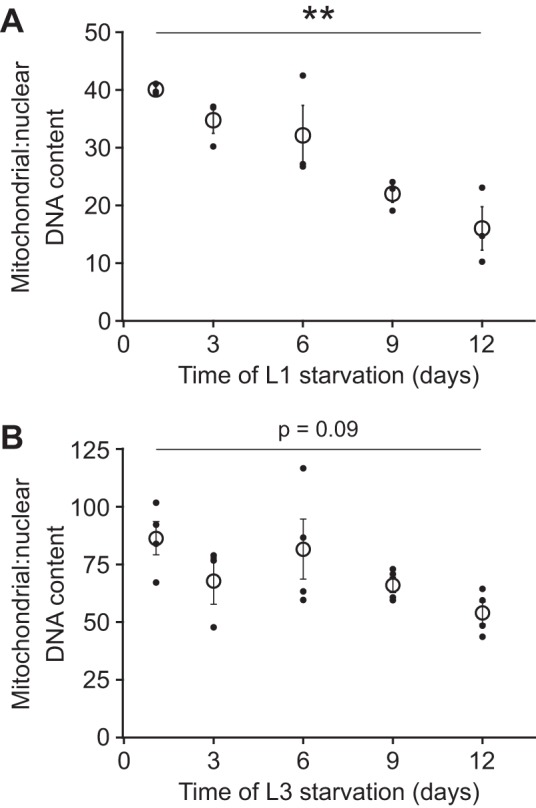
Fig. 2.

Mitochondrial DNA copy number decreases during starvation. A: mtDNA copy number relative to nuclear copy number is plotted over time during L1 starvation. There is a significant reduction in the relative concentration of mtDNA (P = 0.002, 1-way ANOVA, n = 3 biological replicates). A post hoc Tukey’s honestly significant difference (HSD) test indicated that mitochondrial:nuclear DNA content at day 1 was significantly different from day 9 (P < 0.05) and day 12 (P < 0.01). B: mtDNA copy number relative to nuclear DNA copy number is plotted over time during L3 starvation. There is a slight reduction of mtDNA content relative to nuclear DNA over time (P = 0.09, 1-way ANOVA, n = 4 biological replicates). Mitochondrial:nuclear DNA content at day 1 was significantly different from day 9 (P < 0.05, Tukey’s HSD test) and day 12 (P < 0.01, Tukey’s HSD test). Solid points are values from individual biological replicates, and open circles are means of these values. Error bars represent SE. **P ≤ 0.01.
